We continue with the mtcars dataset to illustrate a few more correlation plots – this time, the pair plots.
library(GGally)
ggpairs(car_data[,1:7])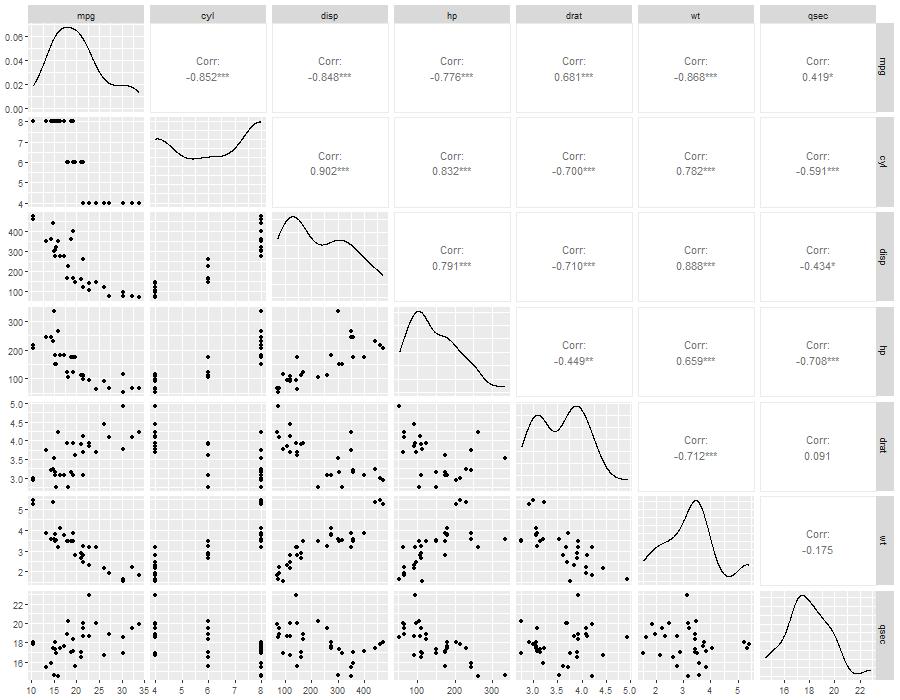
- The main diagonal represents the data distribution of the variable
- The upper half diagonal represents the correlation coefficients
- The lower half diagonal represents a scatter plot between pairs
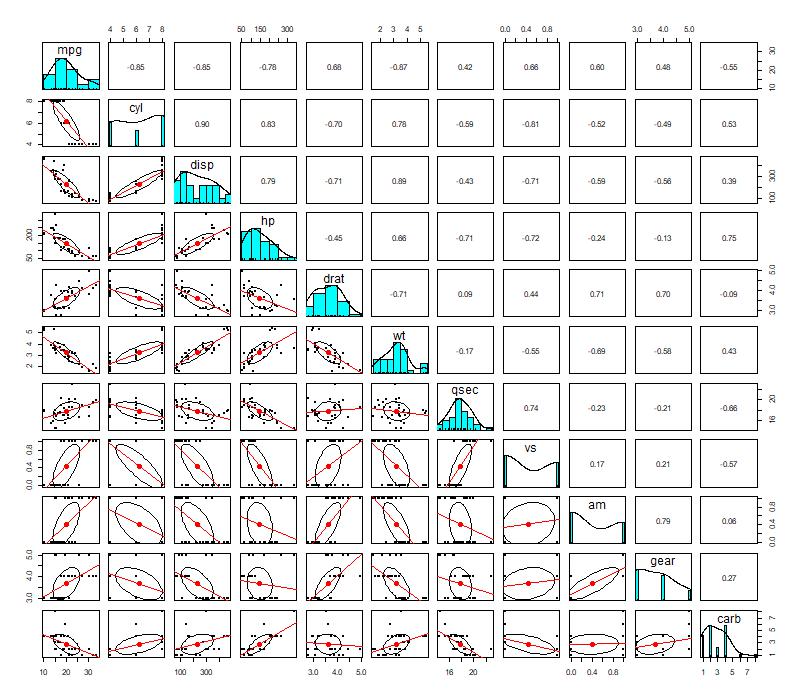
library(psych)
pairs.panels(car_data, lm = TRUE)