Last time we saw the statistics on police violence and death rates. The data may have given you a false impression that most of the homicides in the US are caused by the police. The number of homicides in the US ranged from 15,000 (5 in 100,000) to 24,000 (7.5 in 100,000) annually in the last 20 years. The total number of deaths from police violence was 30,800 but spread over 40 years – in the range of 4-5% of the annual homicides.
Here are a few more statistics. About 70% of the murders were caused by the use of firearms, based on the 2019 and 2020 data. Does that mean guns are used mostly to kill others? Well, 60% of gun-related deaths were suicides!
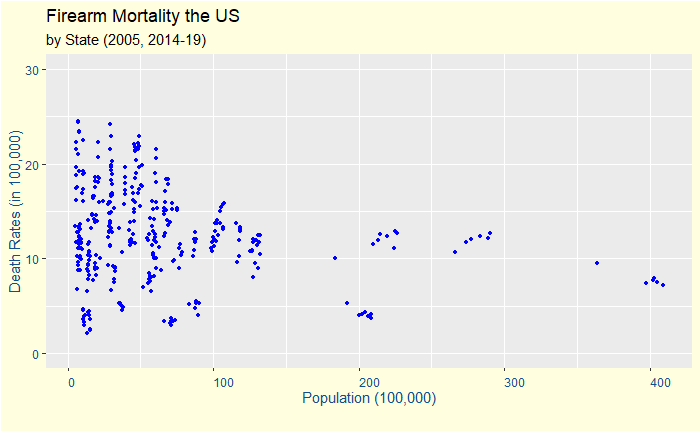
Before we close this gloomy topic: the CDC publishes firearm-related deaths for various states in the US. Alaska tops the rate in 2019 with 24.4 deaths per 100,000 people. Following is a plot of death rates vs the population (7 years of combined data).

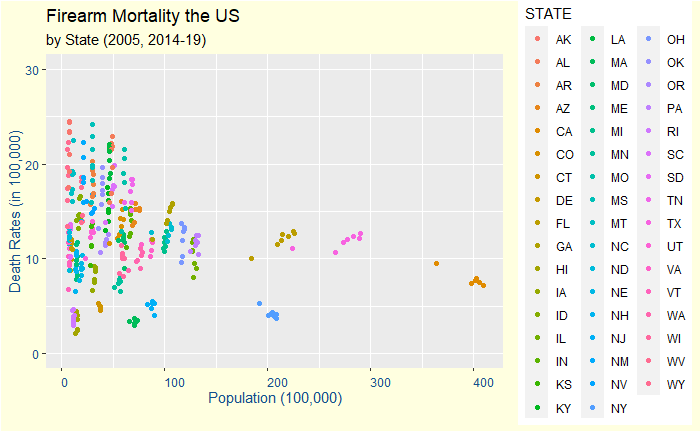
At first, it reminded me of an older post on life in a funnel. Is it an artefact of randomness in small population sizes? We need to check further. Let us differentiate states with colour.

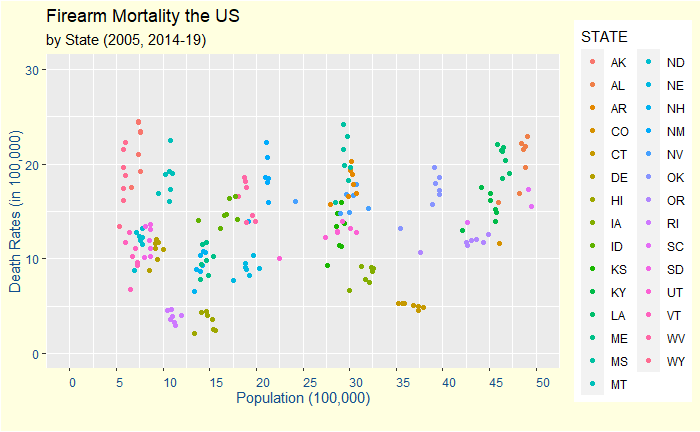
Zoom in to the lower 29 states.

It’s a mixed bag!
As is the case with a lot of things in life – there are randomness and clear patterns. There are fluctuations in the data at lower population states. But there are also definite clusters among those states.
References
- All homicides: CDC
- Crime in the US: FBI
- Firearm Mortality: CDC
- Gun deaths in the US: Pew Research
- Murders in 2020: Pew Research

