An outlier is an anomalous value in the dataset. Consider the following dataset.
| 1.97 | 2.1 | 0.9 | 1.8 | 2.2 |
| 1.4 | 1.85 | 1.31 | 1.92 | 1.8 |
| 1.54 | 10.7 | 1.33 | 1.71 | 2.4 |
| 1.62 | 1.22 | 1.7 | 1.63 | 1.6 |
| 1.79 | 1.52 | 1.83 | 1.8 | 1.69 |
Sort
Do you identify the outlier here? The easiest way is to sort the data in ascending order.
| 0.9 | 1.22 | 1.31 | 1.33 | 1.4 |
| 1.52 | 1.54 | 1.6 | 1.62 | 1.63 |
| 1.69 | 1.7 | 1.71 | 1.79 | 1.8 |
| 1.8 | 1.8 | 1.83 | 1.85 | 1.92 |
| 1.97 | 2.1 | 2.2 | 2.4 | 10.7 |
The value at the bottom right appears suspicious. The average of the set with the last value is 2.05, and that without is 1.69.
Plot
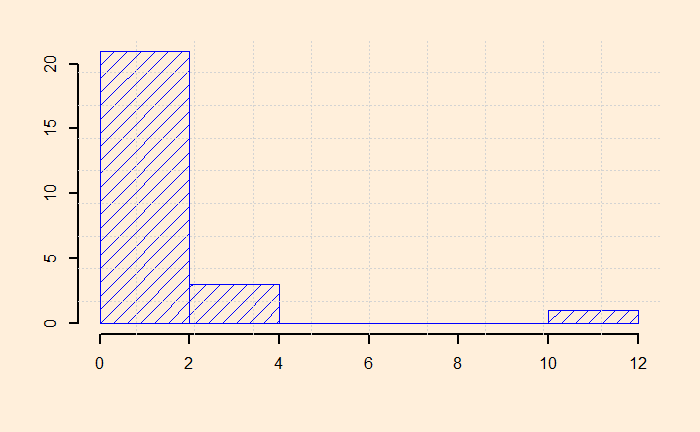
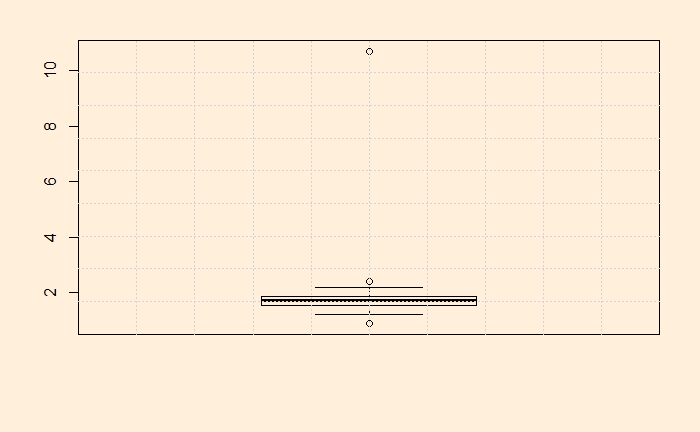
Another way to identify an outlier is to plot.


