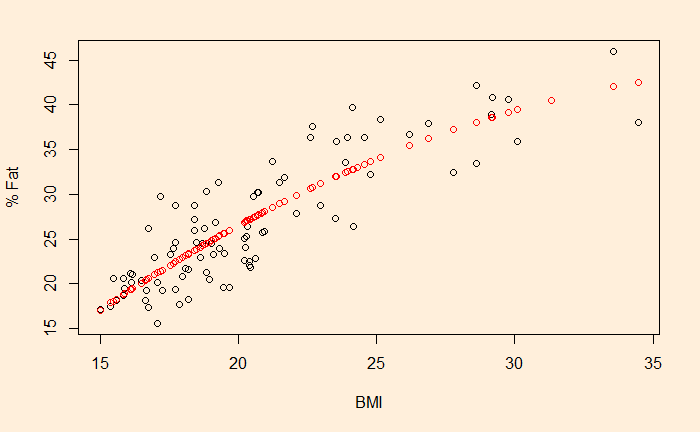
We have seen linear regression last time. While fitting a line could be a good start, one needs to exercise care before choosing it as the default. For example, see the plot below.

It gives the relationship between body mass index and body fat percentage, taken from Regression Analysis Book by Jim Frost. Warning: I’m not sure if the data was simulated or data.
Check what happens if you try and fit a straight line!

fit<-lm(BMI_Data$X.Fat ~ poly(BMI_Data$BMI,2,raw=TRUE))
quadratic = fit$coefficient[3]*BMI_Data$BMI^2 + fit$coefficient[2]*BMI_Data$BMI + fit$coefficient[1]

lines(BMI_Data$BMI,fit$coefficient[3]*BMI_Data$BMI^2 + fit$coefficient[2]*BMI_Data$BMI + fit$coefficient[1], col="red", type = "p")

