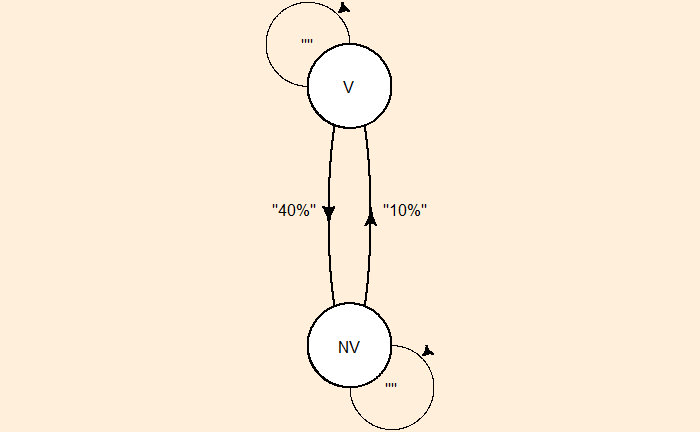
Let’s take another example. For a particular website, 40% of visitors don’t return next time. Of the non-visitors, 10% turn up next time. What is the website’s end-state distribution? Let V represent the visitor and NV the non-visitor.
We know the property of the end state: the distribution at which P X* = X*. Let’s fill in the available data.
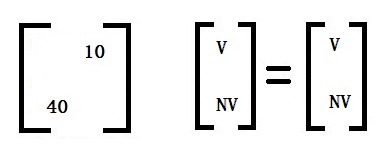
The columns must add up to 100% or 1.
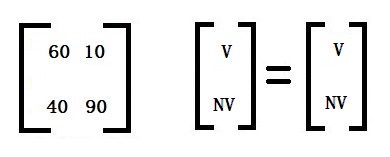
Let’s now expand the equation and change percentage data to fractions.
0.6 V + 0.1 NV = V
0.4 V + 0.9 NV = NV
NV = 4 V
But we know V + NV must be 1
V + 4 V = 1
V = 1/5
NV = 4/5
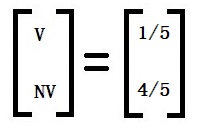
20% will visit, and 80% won’t.

