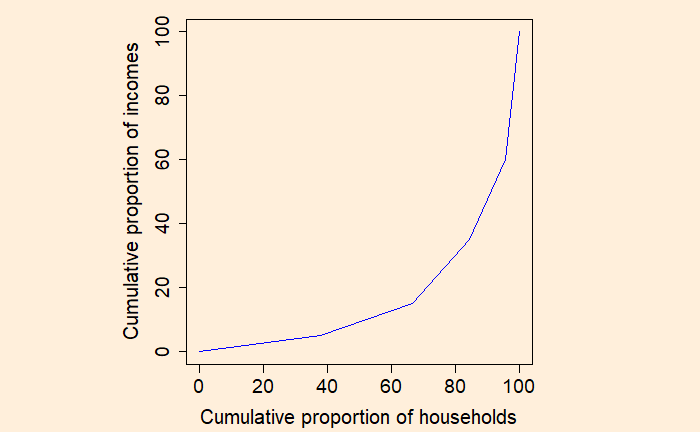
The plot of cumulative household income vs cumulative households is called a Lorenz curve. Let’s build a hypothetical one using R.
Step 1: the households are organised according to their incomes, from the lowest to the highest.
income <- c(100, 200, 400, 500, 800)
household <- c(85, 65, 40, 25, 10)
Step 2: The cumulative proportions of incomes and households are calculated.
cum_income <- cumsum(income)*100/sum(income)
cum_household <- cumsum(household)*100/sum(household)
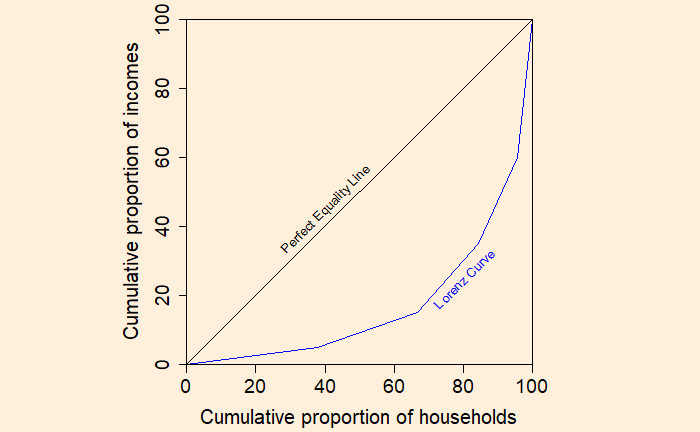
Step 3: Plot the cumulative proportion of households against the cumulative proportion of income to get the Lorenz curve.

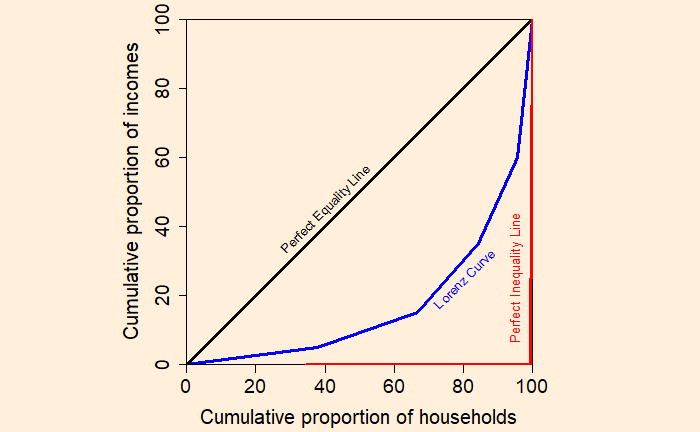
If every household has the same income, the Lorenz curve passes through the diagonal. And it is called the perfect equality line.

On the other extreme, if one household has all the income, you get the perfect inequality line.

Gini Coefficient
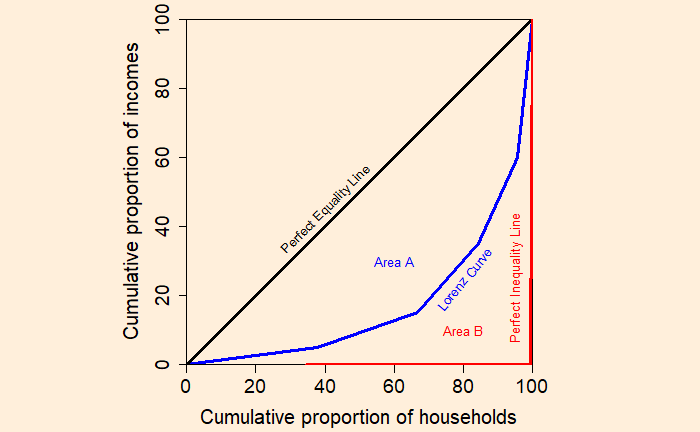
Let the area between the perfect equality line and the Lorenz curve be A, and the area under the Lorenz curve be B.
Gini coefficient = Area A / (Area A + Area B)

Case 1: If the Lorenz curve coincides with the perfect equality line
Gini coefficient = 0 / (0 + Area B) = 0; perfect equality
Case 2: If the Lorenz curve coincides with the perfect inequality line
Gini coefficient = Area A / (Area A + 0) = 1; perfect inequality

