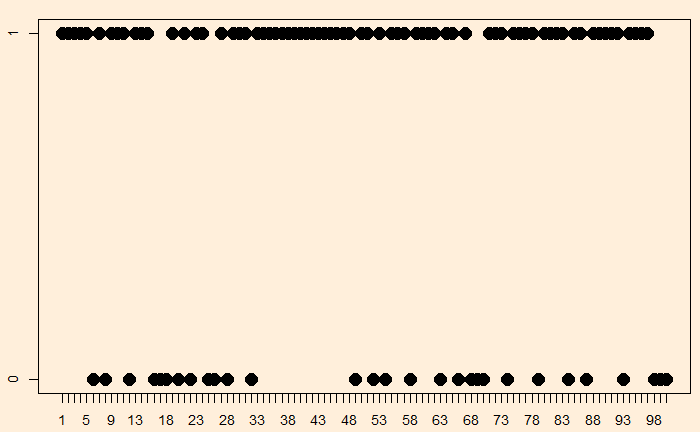
It is a well-known fallacy to attach randomness with uniformity. And clusters are attributed to some reasoning. Here are 100 attempts on a basketball shooter who has 70% accuracy simulated.
bas_b <- sample(c(1, 0), 100, replace = TRUE, prob = c(7/10, 3/10))
You will see large clusters of successes (black dots) and a few clusters of emptiness. Overall, he is successful 70% of the time.
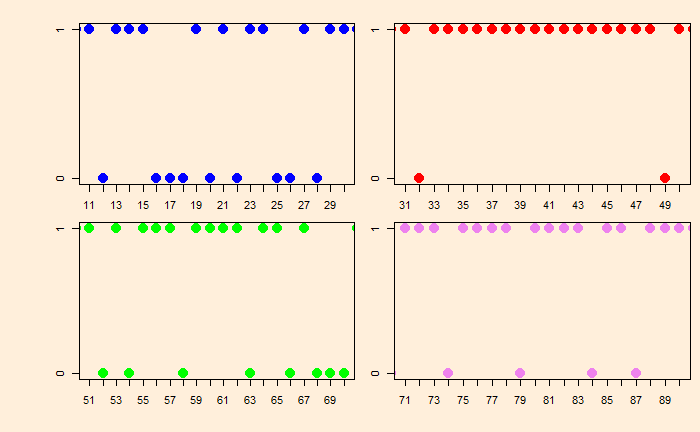
Imagine this happened over six games, and we show snapshots of four sub-sets of the plot as four different days of play.

Day 1 seems a very ordinary performance, followed by an excellent day 2.

