We have seen perceived culpability vs probability distribution of evidence and their overlapping nature in the last post. It offers a simple picture, but the message demonstrates the difficulties of establishing justice for all. Today, we will go a step deeper by invoking signal detection theory, a strategy that can help detect signals from noise.
One technique to raise the level of justice (reduce misses and false alarms) is to increase the distance between the distribution curves from each other. Let’s look at it quantitatively: imagine you want not more than 5% misses and 5% false alarms, then the separation required between the two curves should be something like the following picture.
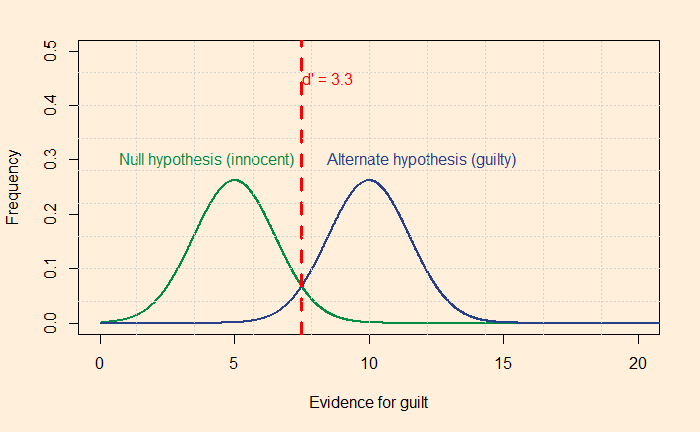
The red dotted line passes through the point on the 95th quantile of the green curve (calculated by the R formula, qnorm(0.95, 5, 1.52), where five is the mean and 1.52 is the standard deviation). You already know the meaning of 95% – it is 1.64 standard deviations away from the mean (equivalent to the one-sided confidence interval). The line also should match the left 5% of the blue curve (qnorm(0.05, 10, 1.52). One way to quantify the separation is to estimate the distance between the two distributions as a function of the standard deviation of the innocent.

For the above plot, the separation is 3.3 standard deviations. If you wanted to see a more just system with a maximum of 1% errors, you need a detachment of 4.7.
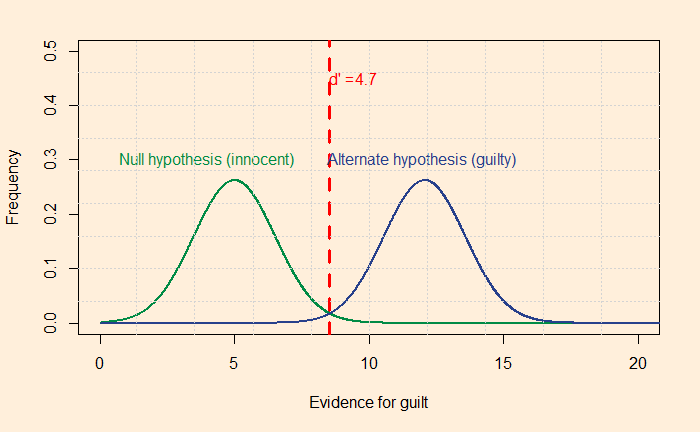
Are 3.3 and 4.7 realistic?
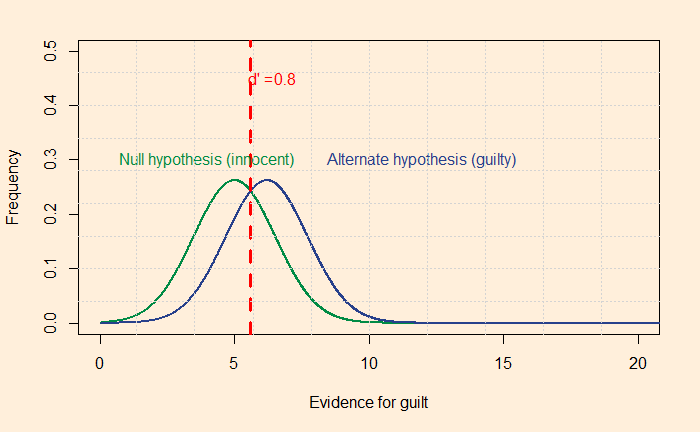
Unfortunately, the answer is no! Look at some indicators that experimentalists have found out. For spotting lie, the d’ values obtained by studies stand at 0! d’ ranged from 0.6 to 0.9 for the polygraph test; the best-in-class gave close to 2.5, but that was exceptional.
Then come eyewitnesses: researchers did a meta-analysis of 120 studies and found d’ values of 0.8 on facial identification. Following is how d’ = 0.8 appears.
Medical tests have typically higher levels of d’ values but fall short of 3 (CT scans 3.0, mammograms 1.3 etc.), suggesting getting a 5% error level is a target difficult to achieve. What more can we do? We will see next.
Do juries meet our expectations?: Arkes and Mellers
Rationality: Steven Pinker

