If autocorrelation represents the correlation of a variable with itself but at different time lags, cross-correlation is between two variables (at time lags). We will use a few R functions to illustrate the concept. The following are data from our COVID archives.

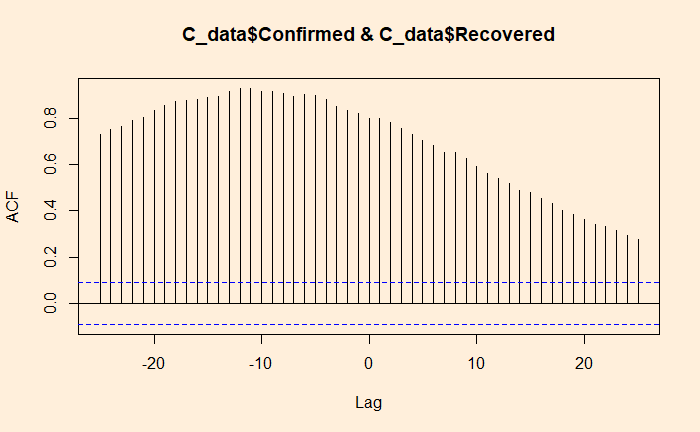
‘ccf’ function of ‘stats’ library is similar to ‘acf’ we used for the autocorrelation. Here is the cross-collation between the infected and the recovered.
ccf(C_data$Confirmed, C_data$Recovered, 25)
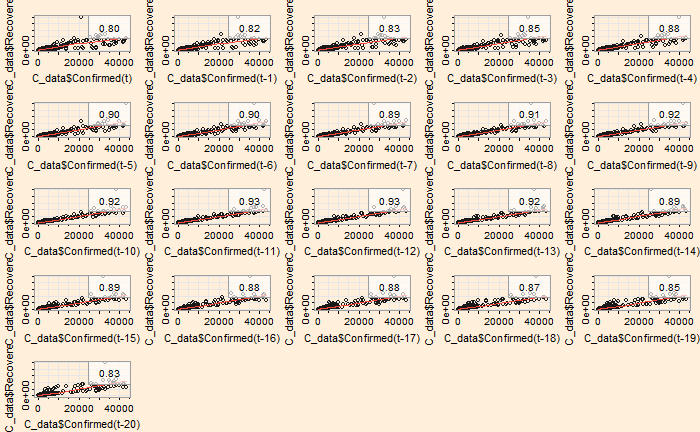
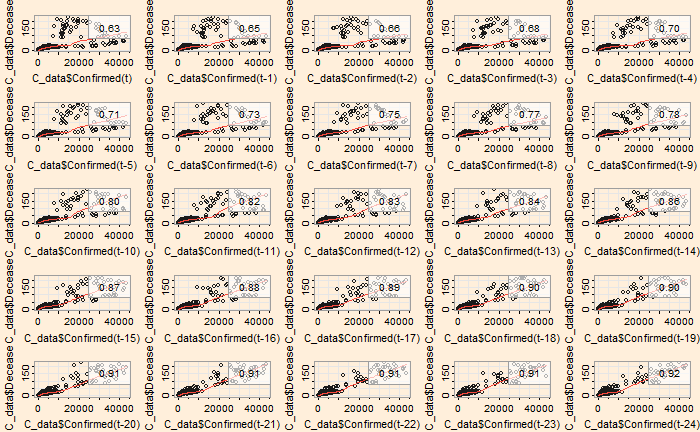
The ‘lag2.plot’ function of the ‘astsa’ library presents the same information differently.
lag2.plot(C_data$Confirmed, C_data$Recovered, 20)
The correlation peaked at a lag of about 12 days, which may be interpreted as the recovery time from the disease. On the other hand, the infected vs deceased gives a slightly higher lag at the maximum correlation.


