‘mtcars’ is a popular dataset which is used to illustrate a bunch of statistical concepts. The data is collected from the 1974 Motor Trend US magazine and comprises fuel consumption and ten aspects of automobile design and performance for 32 automobiles (1973–74 models). It is a built-in dataset in R, and the first few lines may be seen using the following command.
head(mtcars)
The following are the variables in the set.
| Variable | Explanation |
| mpg | Miles (US) gallon |
| cyl | # of cylinders |
| disp | Displacement (cu.in.) |
| hp | Gross horsepower |
| drat | Rear axle ratio |
| wt | Weight (1000 lbs) |
| qsec | 1/4 mile time |
| vs | Engine (0 = V-shaped, 1 = straight) |
| am | Transmission (0 = automatic, 1 = manual) |
| gear | # of forward gears |
| carb | # of carburettors |
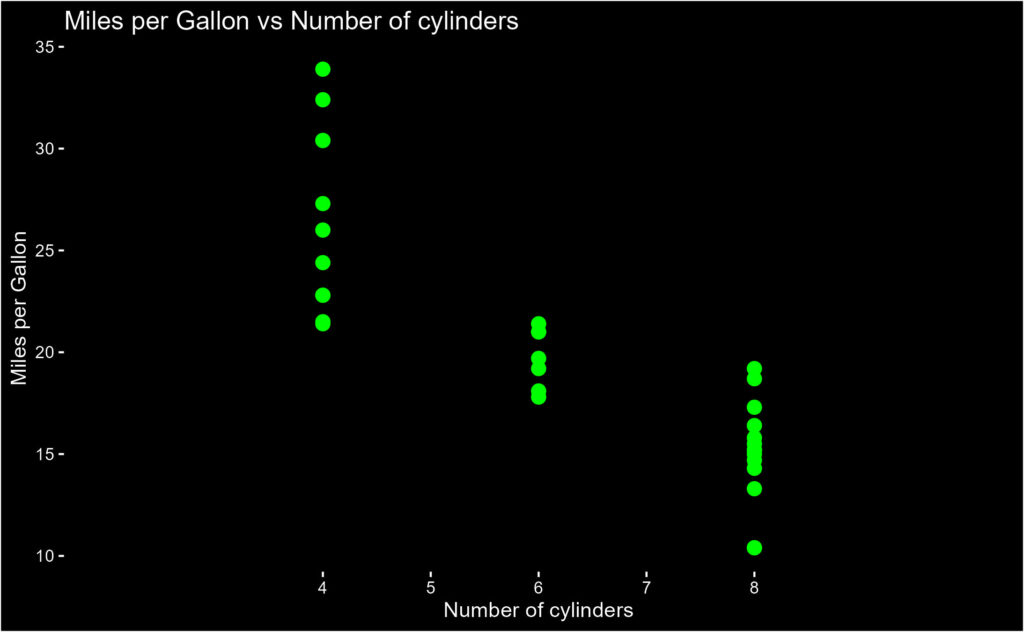
The data enables one to find out the relationship between the different characteristics with the fuel efficiency of cars. E.g., the following plot relates the miles per gallon with the number of cylinders.

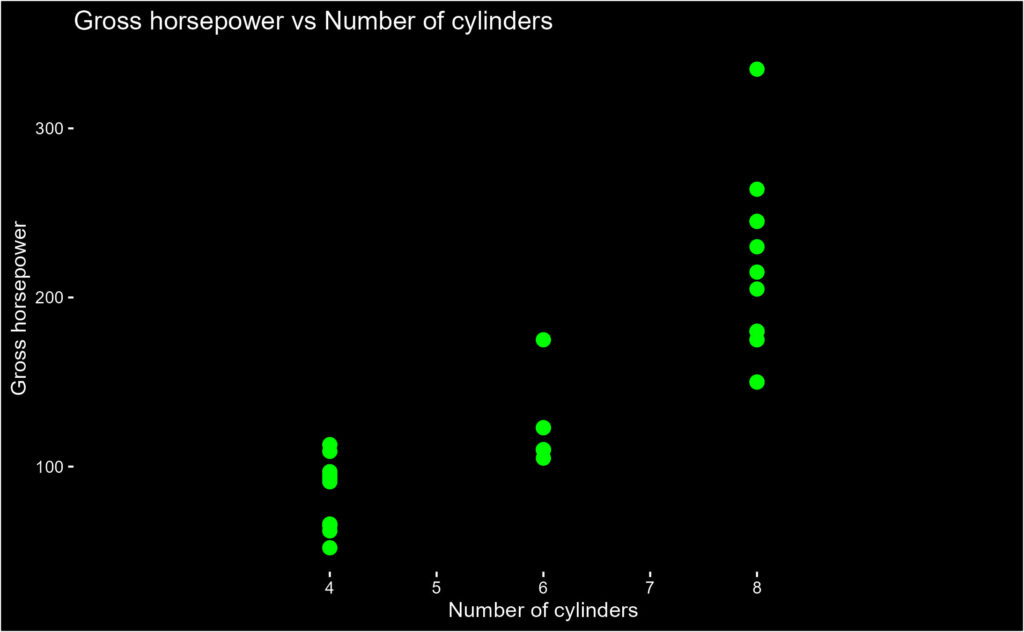
Or how the gross horsepower is related to the number of cylinders.


