Machine learning is a technique to train a model (algorithm) using a dataset for which we know the outcome and then use the algorithm, making predictions where we don’t have the outcome. The confusion matrix is the summary in a tabular form, highlighting the model performance.
Height data
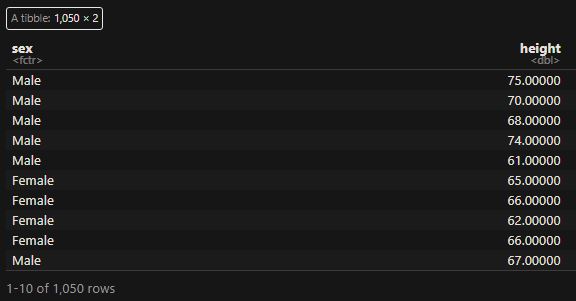
We develop a simple machine learning algorithm predicting the sex of a person from the height data. The R package to help here is ‘caret’. Here are the first ten entries of the dataset that contains 1050 members.

The first thing is to check whether we can distinguish between the heights of males and females. The following command summarises the mean and standard deviation of heights.
heights %>% group_by(sex) %>% summarize(Mean = mean(height), SD = sd(height))
Yes, the males are a little taller than the females, and we use this property to make decisions. I.e., assign the output as male if the height is greater than 64 inches and female otherwise. But before getting into the calculations, we divide the dataset randomly into two halves – training set and test set – using the ‘createDataPartition’ in the ‘caret’ package.
test_index <- createDataPartition(heights$height, times = 1, p = 0.5, list = FALSE)
train_set <- heights[-test_index,]
test_set <- heights[test_index,]
Now, we have two sets with 526 members each. We apply the algorithm to the training set and see the results.
y_hat <- ifelse(train_set$height > 64, "Male", "Female") %>%  factor(levels = levels(train_set$sex))
mean(y_hat == train_set$sex)
We apply the formulation to the test set and get the confusion matrix.
y_hat <- ifelse(test_set$height > 64, "Male", "Female") %>%
  factor(levels = levels(test_set$sex))

confusionMatrix(data = y_hat, reference = test_set$sex)
Confusion Matrix and Statistics
Reference
Prediction Female Male
Female 55 24
Male 64 383
Accuracy : 0.8327
95% CI : (0.798, 0.8636)
No Information Rate : 0.7738
P-Value [Acc > NIR] : 0.0005217
Kappa : 0.4576
Mcnemar's Test P-Value : 3.219e-05
Sensitivity : 0.4622
Specificity : 0.9410
Pos Pred Value : 0.6962
Neg Pred Value : 0.8568
Prevalence : 0.2262
Detection Rate : 0.1046
Detection Prevalence : 0.1502
Balanced Accuracy : 0.7016
'Positive' Class : Female
In the tabular form,
| Actual | |||
| Female | Male | ||
| Predicted | Female | 55 | 24 |
| Male | 64 | 383 |
The rows on the confusion matrix present what the algorithm predicted, and the columns correspond to the known truth. The output provides a bunch of other metrics. That is next.

