Imagine you live in a town of ten thousand inhabitants. And you wanted to understand some of their habits, say, what type of food they eat, the festivals they celebrate etc. What will you do?
You go and ask every one of them. That could well be possible, as the town is not that big, 10,000 people. But you think it is a lot of effort, and you decide to employ a sampling agent. She goes to the supermarket and takes a survey of 100 people. She just did that and now tells you what she found.
She averaged the survey results and made a point estimate. She did some math and established confidence intervals to communicate. She says: “I can say with 95% confidence level that the average person of the town eats between 4.6 to 5.4 loaves of bread a day”. How do we understand her?

The first thing is about the range – she gave a range [4.6 to 5.4]. It may have suggested you a mean (the bird in the picture) equals five and a spread (of its wings) of +/- 0.4. Then she says about a confidence interval as a percentage. What it means is if one does 100 such samples, 95 of the samples may have ranges that include the true average of the population – the latter is a big unknown as she never got a chance to sample everyone. This sample could be one of them, but we never know, as it was the only sample.
Some examples are below.

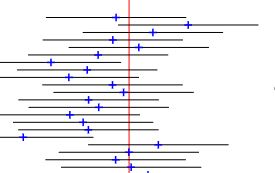
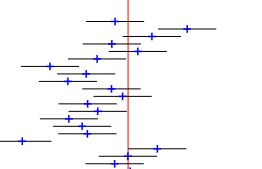
Note: as the value of the confidence interval increases, the length of the wings, some multiples of the standard deviation, also increases. More on how to construct a confidence interval is in another post.

