So far, I have addressed the collider-bias phenomena qualitatively. This time, I will try to show through numbers. It can be complex as the illustration involves a lot of arithmetic. The reference material provided at the end is a good read, further grasping the concept.
Imagine a situation where exposure is obesity, the risk factor is smoking, the outcome is mortality, and the collider is diabetes. If you are confused about what each represents, here is the expected storyline: A research group does study the impact of obesity on mortality in a set of people who have diabetes and comes up with a counterintuitive conclusion (perhaps that obesity decreases mortality)!
Set of information
Total study population = 1000
Smokers = 500
Non-smokers = 500
Obese = 500
Non-obese = 500
Baseline diabetes risk (non-smoking, non-obese)= 4%
Obesity increases diabetes risk by 16 % points
Smoking increases diabetes risk by 12% points
Baseline mortality risk (non-smoking, non-obese, nondiabetic)= 5%
Obesity increases mortality risk by 2.5% points
Smoking increases mortality risk by 15% points
Diabetic increases mortality by 5%
Calculations on the total sample
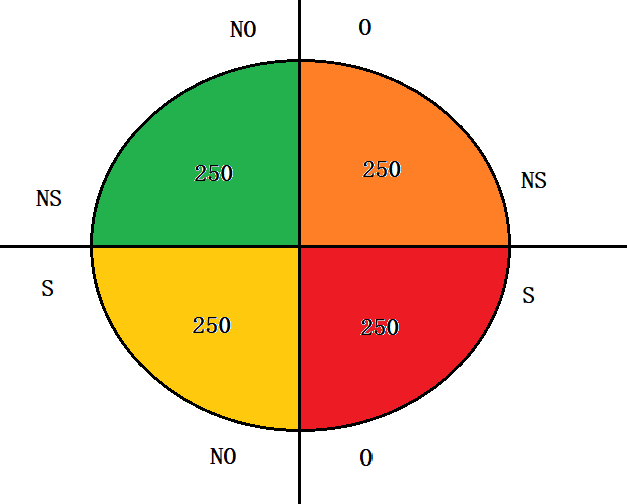
The overall study population is depicted as

Now, calculate the mortality rates of each quadrant and portion into obesity and non-obesity conditions.
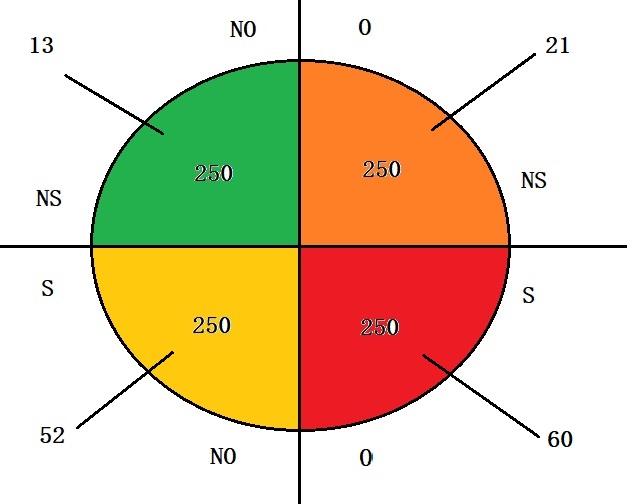
Total mortality of NS-NO (non-smoking, non-obese) quadrant
= # of diabetic x diabetic mortality + # non-diabetic x baseline mortality
= 0.04 x 250 x (0.05 + 0.05) + (250 – 0.04 x 250) x 0.05
= 1 + 12 = 13
(note that diabetic mortality = baseline mortality + diabetic increases mortality)
S-NO (smoking, non-obese) quadrant
= # of diabetic x (diabetic mortality + smoking mortality) + # non-diabetic x (Baseline mortality + smoking mortality)
= (0.04 + 0.12) x 250 x (0.05 + 0.05 + 0.15) + (250 – (0.04 + 0.12) x 250) x (0.05 + 0.15)
= 52
S-O (smoking, obese) quadrant
= (0.04 + 0.12 + 0.16) x 250 x (0.05 + 0.05 + 0.15 + 0.025) + (250 – (0.04 + 0.12 + 0.16) x 250) x (0.05 + 0.15 + 0.025)
= 60
NS-O (non-smoking, obese) quadrant
= (0.04 + 0.16) x 250 x (0.05 + 0.05 + 0.025) + (250 – (0.04 + 0.16) x 250) x (0.05 + 0.025)
= 21

Calculations (for the total sample)
Mortality rate with obesity = (60 + 21) / 500 = 16.5%
Mortality rate without obesity = (13 + 52) / 500 = 13%
An increase of 3.5%
Calculations on the sub-sample
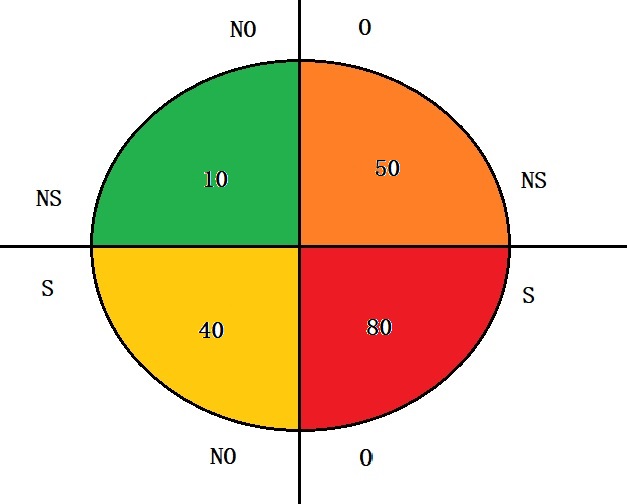
Suppose the study stratified the sample and analysed only people who have diabetes. The study sample space is as follows.

Do the same exercise as before
NS-NO quadrant
= # of diabetic x diabetic mortality
= 0.04 x 250 x (0.05 + 0.05)
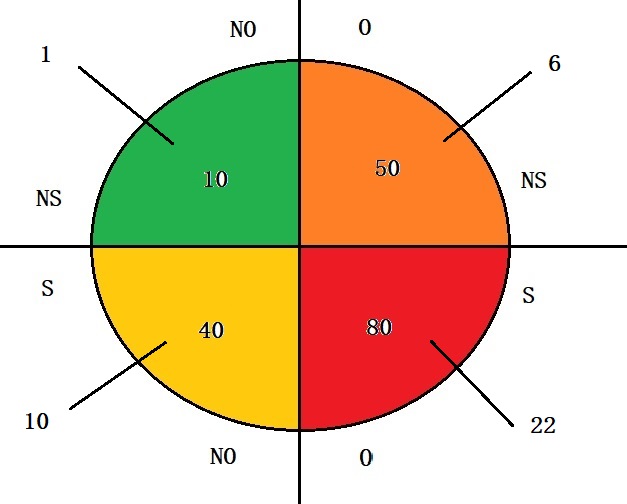
= 1
S-NO quadrant
= # of diabetic x (diabetic mortality + smoking mortality)
= (0.04 + 0.12) x 250 x (0.05 + 0.05 + 0.15)
= 10
S-O quadrant
= (0.04 + 0.12 + 0.16) x 250 x (0.05 + 0.05 + 0.15 + 0.025)
= 22
NS-O quadrant
= (0.04 + 0.16) x 250 x (0.05 + 0.05 + 0.025)
= 6

Calculations (for the sub-sample)
Mortality rate with obesity = (22 + 6) / 130= 21.5%
Mortality rate without obesity = (1 + 10) / 50= 22 %
A decrease of 0.5%
Reference
Collider Bias in Observational Studies: Dtsch Arztebl Int.

