We have seen how a seemingly profitable game, because of its positive expected value and high average compounding rate, still leads to losses for the average player.
For example, in a simulation of 10000 people betting up to 50 times starting with $100, the number of them ending up with less than the initial amount is:
| # Bets | # that lost money (out of 10,000) |
| 20 | 5805 |
| 30 | 7057 |
| 50 | 7560 |
The original game implied an average gain of 15% per toss but at a certain probability of winning and losing. It assumed the individual was betting all the money she had earned so far in the subsequent bet. Here, we vary the amount per bet as a fraction of the total and then calculate the optimum fraction that yields profit to the median. But first, the misleading average wealth after 50 wagers, starting with $100.

It’s absurd to see how the gain rises exponentially. Then, we look at the median outcome for the individuals.

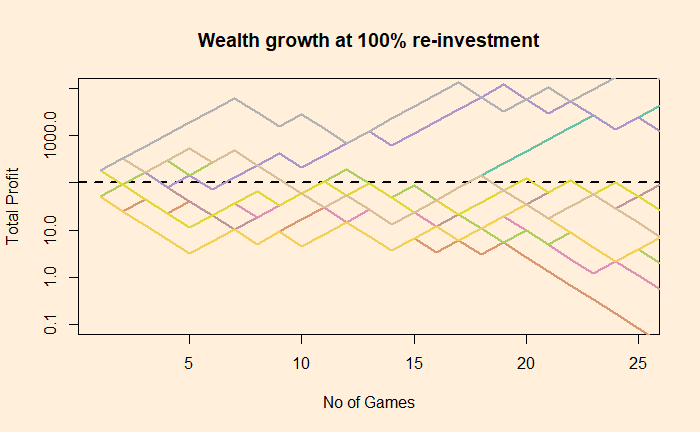
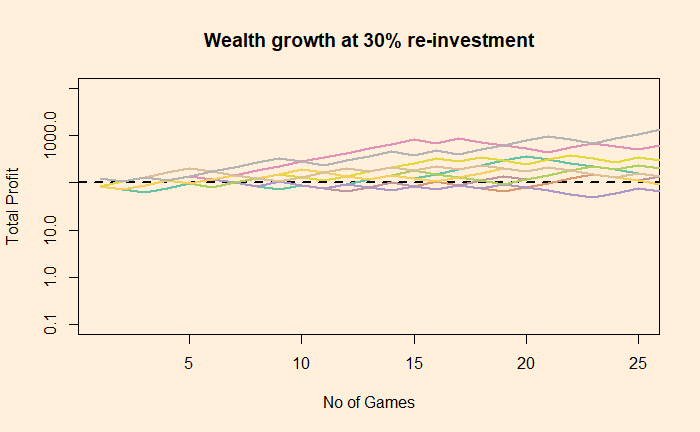
We notice there is an optimum strategy, somewhere close to 40%, that gives a modest, nonetheless positive return. Two such situations are illustrated based on how ten people performed after 25 games – the batch betted 100% money and the second person 30% each time.


Note that the Y-axis is in the log scale to resolve the variation better over a wide range.

