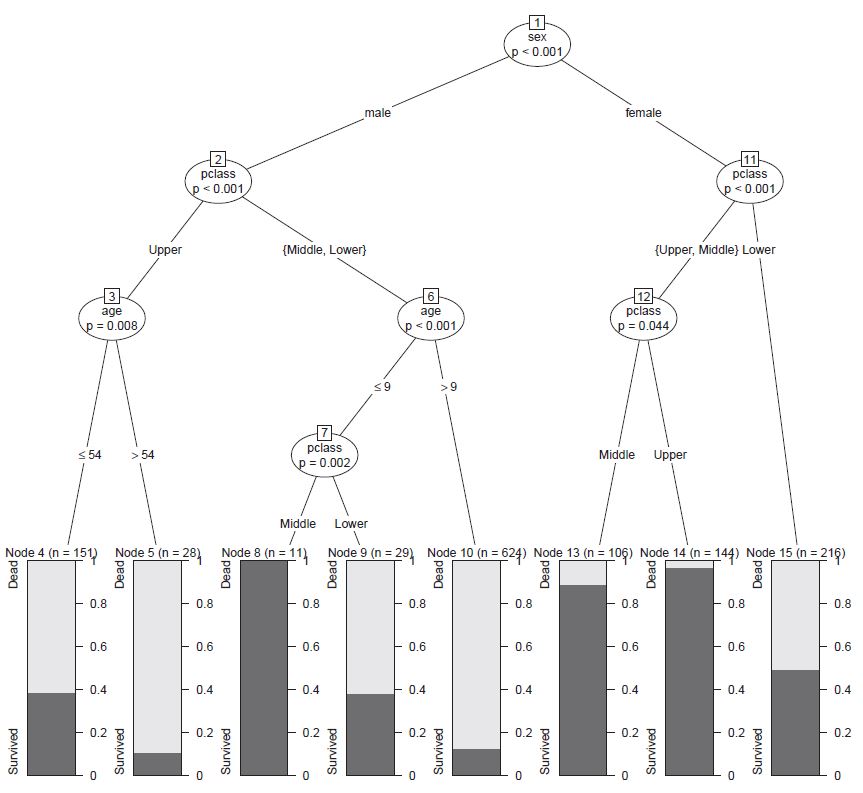
Do you remember Titanic data? We have used it in the past to illustrate mosaic plots. This time, we use it to explain classification trees.
Do you remember Titanic data? We have used it in the past to illustrate mosaic plots. This time, we use it to explain classification trees.

