The dataset, known as the Breast Cancer Wisconsin (Diagnostic) Dataset, was obtained from Kaggle. It was built by Dr Wolberg, who used fluid samples from patients with solid breast masses. It provides ten features of cells from each sample – the mean value, extreme value and standard error of 10 features for the image returning 30 variables. Those ten components are:
- radius
- texture
- perimeter
- area
- smoothness
- compactness
- concavity
- concave points
- symmetry
- fractal dimension
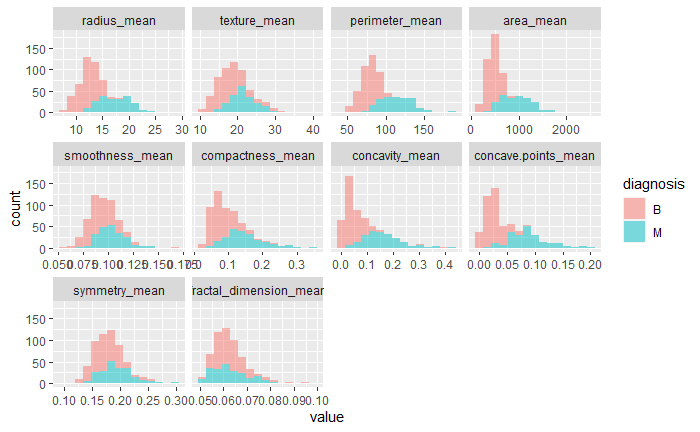
The objective is to match the outcome, and diagnosis, which takes two values vz benign (B) or malignant (M). The following plot gives the overall summary of how the various features compare between benign (B) and malignant (M)

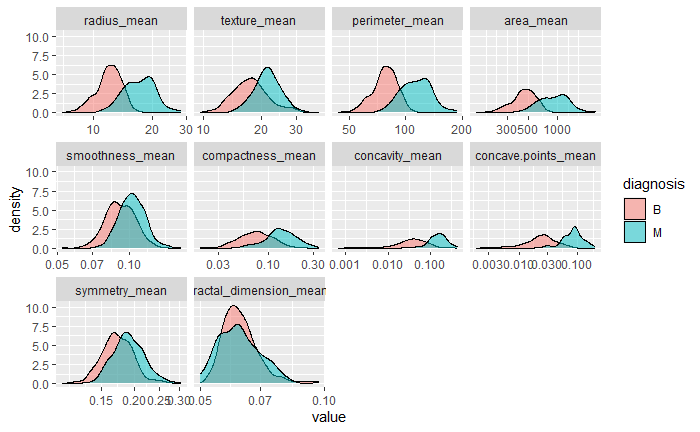
or a density plot

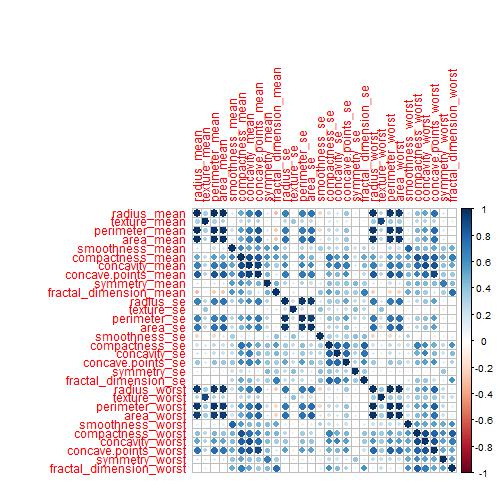
We do a correlation plot next:
corr_mat <- cor(b_data[,2:ncol(b_data)])
corrplot(corr_mat)


