Benford’s law forms from the observation that in real-life datasets, the leading digits or set of digits follow a distribution in a successively decreasing manner, with number 1 having the highest frequency. As an example, take the population of all countries. The data is collected from a Kaggle location, and leading integers are pulled out as follows:
pop_data <- read.csv("./population.csv")

ben_data <- pop_data %>% select(pop = `Population..2020.`)
library(stringr)
ben_data$digi <- str_extract(ben_data$pop, "^\\d{1}")
ben_data$digi <- as.integer(ben_data$digi)
The next step is to plot the histogram using the extracted digits.
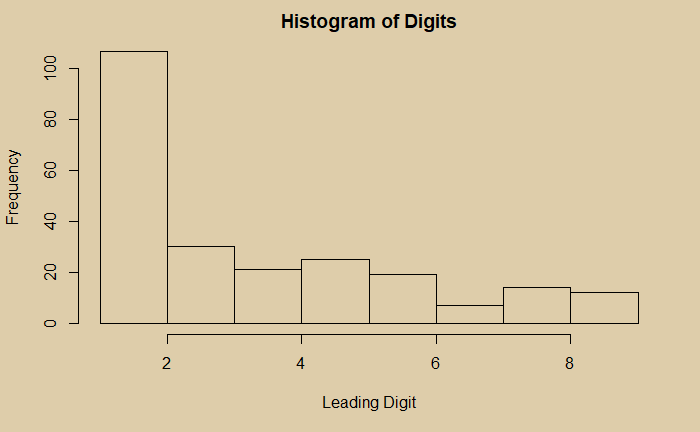
Let’s not stop here, extract the first two digits and plot.


