Continuing from the previous post, we will calculate a few more properties. We start with percentiles.
| 2 | 15 | 29 | 44 | 50 | 61 | 73 |
| 3 | 16 | 32 | 44 | 51 | 62 | 74 |
| 9 | 19 | 32 | 44 | 52 | 69 | 75 |
| 12 | 20 | 37 | 45 | 54 | 69 | 79 |
| 12 | 22 | 38 | 48 | 54 | 69 | 88 |
| 15 | 26 | 38 | 49 | 56 | 72 | 90 |
| 15 | 28 | 38 | 50 | 57 | 72 | 93 |
Percentiles
Percentile, Px, is the value below which x percentage of the data lies. It is calculated as:
![]()
For the problem described above, P10 = 10 x 50 / 100 = 5, for n = 49. I have marked the fifth element of the table in bold (12). Similarly, P90 = 90 x 50 / 100 = 45. The 45th element is 75.
quantile(machine, 0.1)
quantile(machine, 0.9)
Quartiles
Extending it further, we can get the quartiles as P25 (first quartile, Q1), P50 (second quartile, or median, Q2), and P75 (third quartile, Q3). P25 comes out to be (25 x 50 /100), the 12.5th element. You either round it off to the nearest whole number (13) and select the 13th number, which is 26 or take the 12th number and add 0.5x(13th – 12th) = 22 + 0.5 x (26 – 22) = 24. Or 25% of the instruments will fail by 24 weeks. Similarly, P75 = 37.5th element = 69.
Inter-Quartile distance (IQD) is the difference between Q1 and Q3. Here, 69 – 26 = 43.
Variance
Variance is the measure of the variability of the data from the mean
![]()
The square root of the variance is the well-known standard deviation.

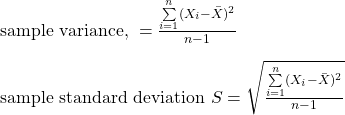
Note that the above equations are for the population. The corresponding entities for the sample are

Chebyshev’s theorem
It is an empirical rule to predict the proportion of observations likely to lie between an interval defined using mean and standard deviation.
![]()
For example, what proportion of data lies between two standard deviations? It is 1 – 1/22 = 0.75 or 75%. In our case, the mean is 44.94, and the standard deviation is 24.19. The interval is between [44.94 – 2 x 24.19] and [44.94 + 2x 24.19] or between -3.44 and 93.32. The number of data between these is everything or 100%! So Chebyshev gives an approximation lower than the exact. You may recall that for normally distributed data, two standard deviations cover about 95% of the data.

