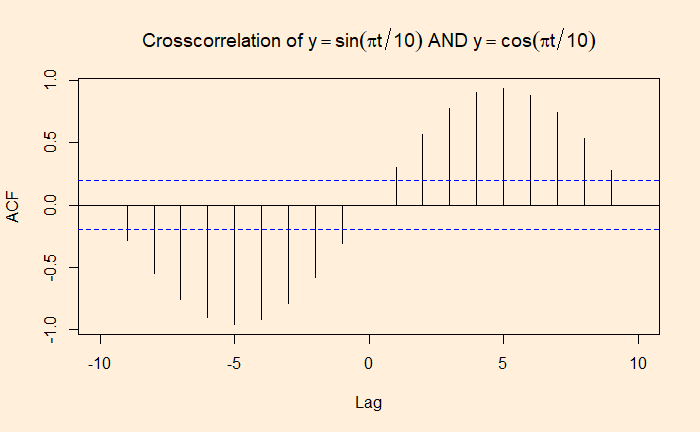
We have seen autocorrelation and cross-correlation functions. This time, we will create a few neat patterns using sinusoidal waves.
sine_wave = sin(pi*1:100/10)
plot(sine_wave, main=expression( y == sin(pi*t/10)), col = "red", type = "l", xlim=c(0,100), xlab = "t", ylab = "y(t)")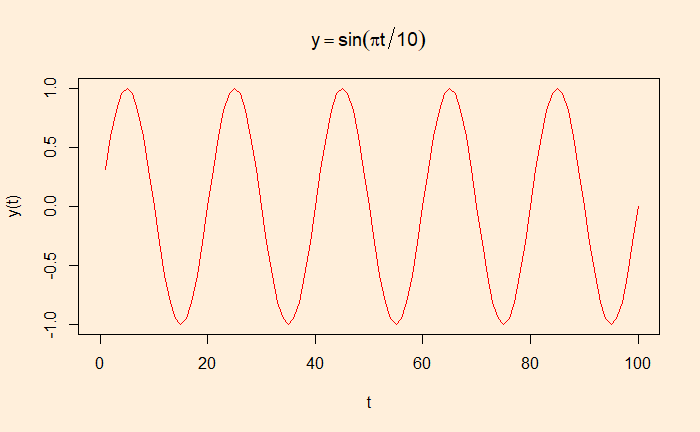
And the autocorrelation of the function is:
acf(sine_wave, lag.max = 80, main = expression(Autocorrelation ~ of ~ y == sin(pi*t/10)))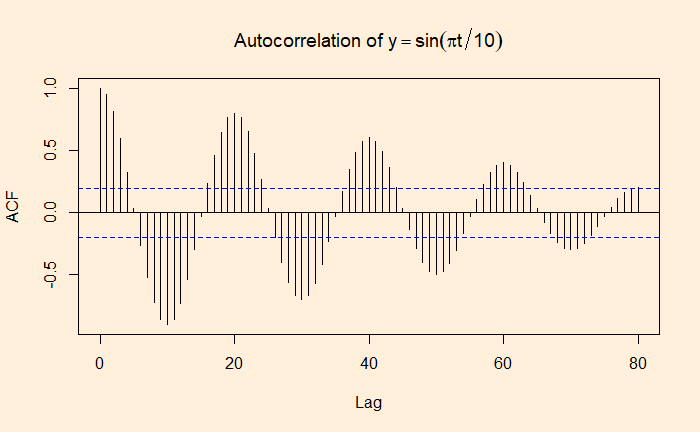
What about a cross-correlation between a sine and a cos wave?
sine_wave = sin(pi*1:100/10)
cos_wave = cos(pi*1:100/10)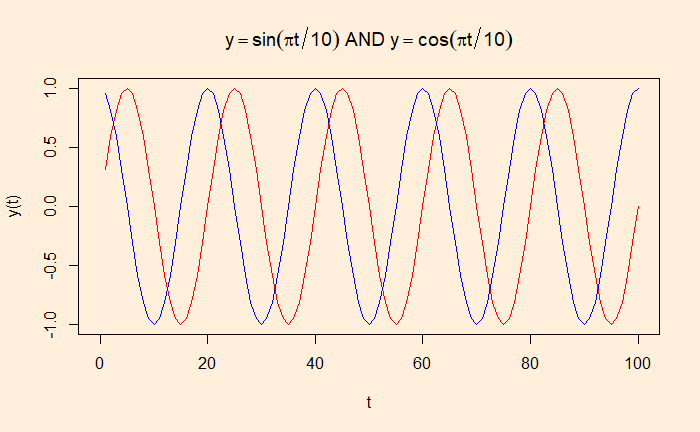
ccf(sine_wave, cos_wave, 80, main = expression(Crosscorrelation ~ of ~ y == sin(pi*t/10) ~ AND ~ y == cos(pi*t/10)))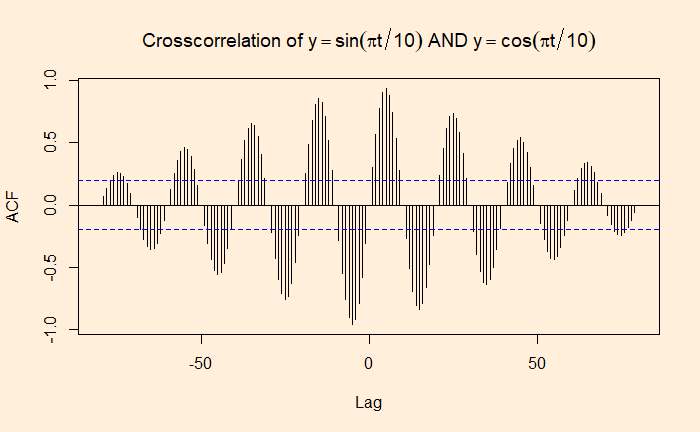
We will zoom the plot to know the maximum cross-correlation, which is expected to be the time delay between the waves; 5 in our case.
