We have built the definitions of data scatter (noise) and bias based on a group of data points in the previous post. This time, we estimate the mean squared errors of the data.
Noise
Here is a collection of data:
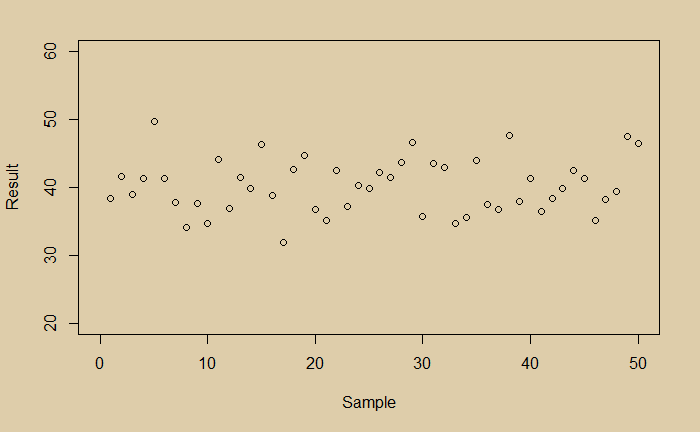
If you are not aware of the bias in the data, you would have calculated the error in the following way. Estimate the mean, calculate deviations for each of the points from the mean, square them and calculate the mean of the squares.
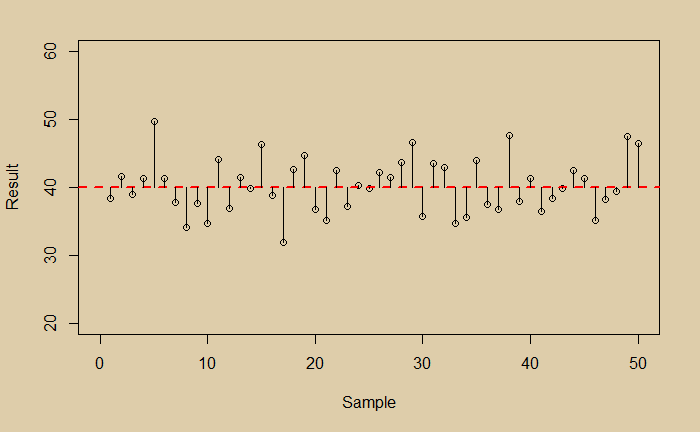
Note that this is also called the variance. For our data, the mean is 40, and the mean square ‘error’ is 15.75.
Somehow, you learned that the data was biased, and the true value was 45 instead of 40. Now you can estimate the mean square error as given below.
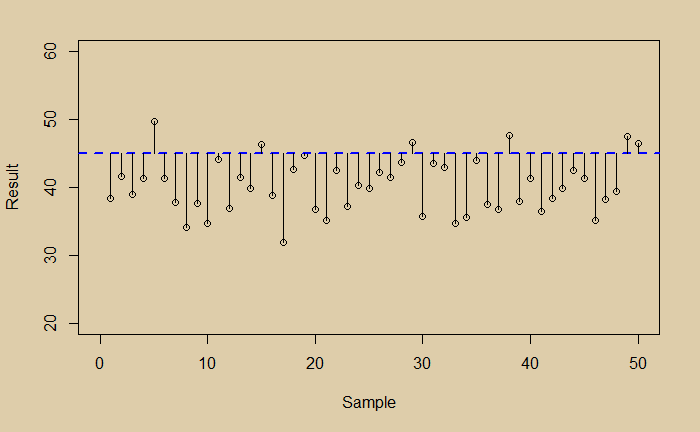
The value of this quantity is 39, which is the combined effect of the error due to noise and bias.
One way of understanding the total error is to combine the error at zero scatter and the error at zero bias. They are represented in the two plots below.
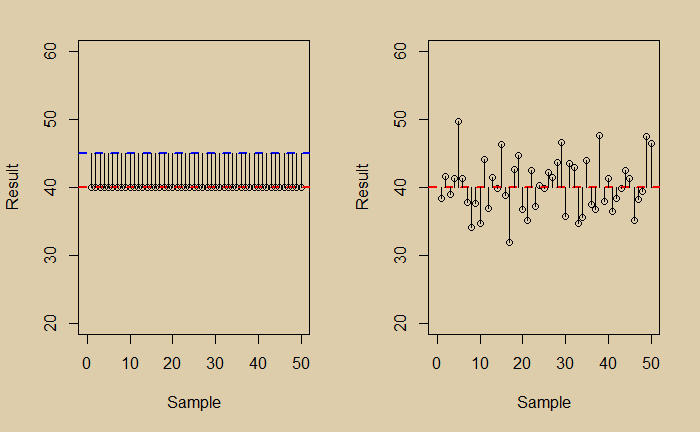
The mean squared error (MSE) in the zero-scatter (left) is 25 (square of the bias), and the zero bias is 15.75. And the sum is 40.75; not far from the total (39) estimated before.
Why MSE and not ME?
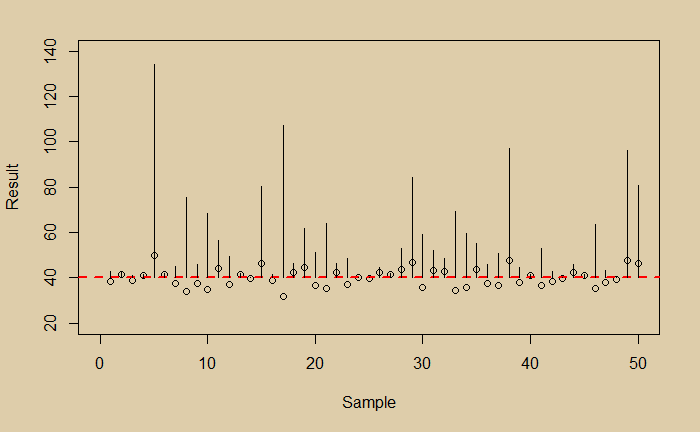
While you may question why the differences are squared, before averaging, it is apparent that in the absence of squaring, the scattered data around the mean, the plusses and minuses, can cancel each other and give a false image of an impressive data collection. On the other hand, the critics will naturally express their displeasure at seeing an exaggerated plot like the one below!
Reference
Noise: A Flaw in Human Judgment: Daniel Kahneman, Olivier Sibony, Cass R. Sunstein

