We have seen how F-statistics work to test the hypotheses in one-way ANOVA. We also know the definition of F as a ratio between two variances. Variances measure how spread the data is around the mean, estimated as the sum of squared deviation divided by the degrees of freedom. If you forgot, you get the standard deviation if you take the square root of the variance.
F = Between groups variance / Within-group variance
F-tests use F-distribution
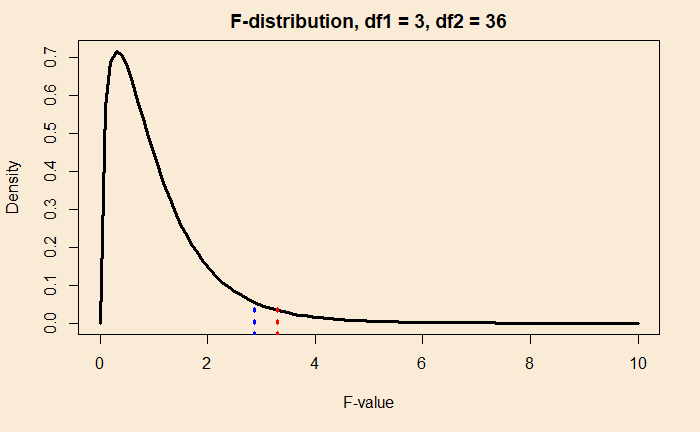
Recall how we used the t-distribution or binomial distribution to determine the probability where the null hypothesis was true. F-distribution, too, has a characteristic shape and is based on two parameters – the degrees of freedom 1 and 2, the ones used in the numerator and denominator, respectively.
In the case of the material strength problem we have been working out in the past two posts (four groups with ten samples each leading to df1 =4-1 = 3 and df2 = 4 x (10-1) = 36), the F-distribution appear in the following form.

One way to understand the above plot is to imagine you are repeating the sampling several times (keeping for vendors and taking ten samples each so that df1 and df2 remain the same), and the null hypothesis is true. You calculate the F values each time. Finally, if you plot the frequency of those F values, you get a plot similar to the one above.

