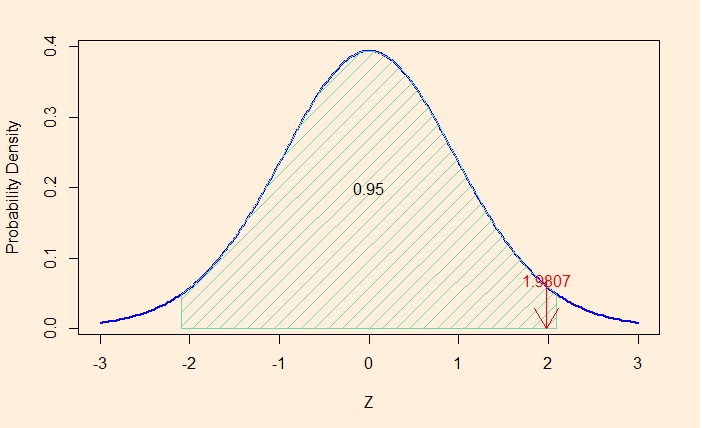
In the previous post, we have done a 1-sample t-test on students’ scores to check for statistically significant changes from the past year’s average. Today we will spend time interpreting the results. First, the results:
	One Sample t-test

data:  test_data$score
t = 1.9807, df = 19, p-value = 0.06229
alternative hypothesis: true mean is not equal to 50
95 percent confidence interval:
 49.80912 56.92088
sample estimates:
mean of x
   53.365
Since there were 20 data points in the study, the degree of freedom (df) is 19. The sample mean is 53.365, which is higher than the reference value of 50; however, the calculated t-value is 1.9807. If you choose alpha (the significance level) to be 0.05 (5%), the t-value should be more than 2.09 to reject the null hypothesis. In other words, 1.9807 is within the 95% confidence area (of the t-distribution).

Remember that not being able to reject the null hypothesis doesn’t mean that you accept the null hypothesis. In simple terms, there is no way to say that the population mean for this year remained at 50. The 95% confidence interval tells you that the actual population mean is between 49.80912 and 56.92088, i.e., the range includes the reference value (50).
Of course, it also doesn’t mean that the sample mean of 53.365 is the new population mean!
Finally, the dear old p-value: the p-value is more than 0.05, which is the standard significance level we chose in the analysis. It is 0.06229.

