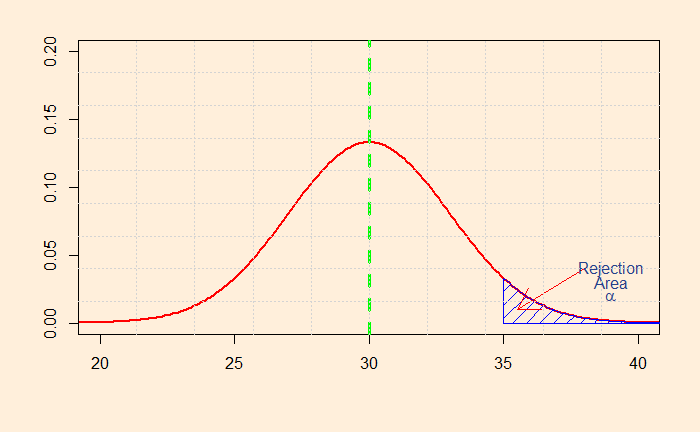
We have seen the significance value alpha as the threshold probability of rejecting the null hypothesis. Let us illustrate it graphically. Consider this hypothesis: The average weighting time of the ticket counter is more than 30 minutes. The null and alternate hypotheses are:
H0: average less than or equals 30
HA: average more than 30
To establish your theory, you need to prove that the mean is greater than 30 (HA) beyond doubt. In the following illustration, the right-hand side tail provides the region you need to show your measured waiting time. That gives the alpha probability for the H0 to be valid.
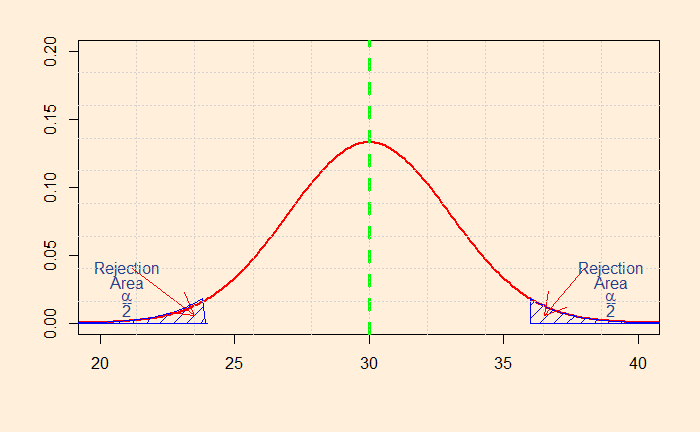
Consider this: the starting monthly salary of computer engineers is $30k. The alternate hypothesis needs to prove this is not the case, the number may be lower or higher (two extremes or tails).
H0: average = $30k
HA: average not equal to $30k