If there is one statistical feature that links all three topics we have discussed in the last three days, starting with the inspection paradox, it will be the weighted average. In simple terms, if you make a random attempt to make a selection, your choice will be over-represented by the heavies. Be it a survey on classes, connecting to friends on social media or the waiting time for buses.
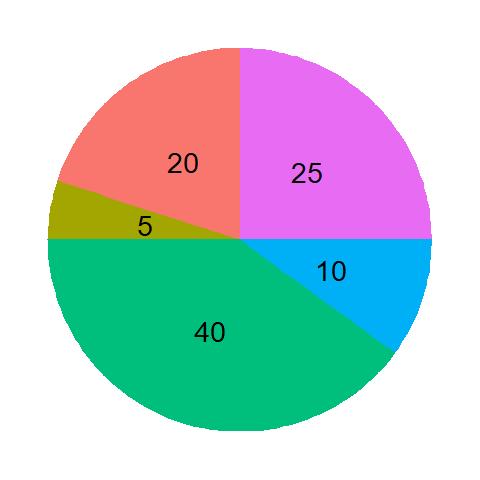
Think about a fortune wheel as depicted below. It’s spinning fast, and you come and touch the surface to stop it. Based on the number inscribed on the section, you get points. Note that the area of the cell is proportional to the number.

Without this information, you would have assumed the (expected) average prize to be 100/5 = 20. But when you look at the figure, you notice that the chances of hitting the different sections are not equal but related to the number on the wheel. To repeat the phrase that we have started with – it is proportionally over-represented by the heavies.
The expected value must take the probabilities. And thefore, it becomes 0.4 x 40 + 0.05 X 5 + 0.20 x 20 + 0.25 x 25 + 0.1 x 10 = 27.5

