We have seen sample and population statistics in an earlier post. We continue developing from there, but this time using the concepts for hypothesis testing. Suppose we have an established population mean and standard deviation. To that, a new sampling statistic is introduced. The task is to test if the understanding (a.k.a. the null hypothesis) needs an update.
![]()
By the way, the resemblance of the equation with the story of constructing the confidence interval is not coincidental. They are both related.
Take an example: A farmer shows sample results (mean = 58 g. from a sample of 40 eggs) and claims eggs from her farm weigh more than the national average. The national average is 54 g. and has a standard deviation of 10 g. How do you test her claim?
First, create the null hypothesis: the farmer’s eggs are within the national average. The alternative hypothesis is that they are heavier than the national. We set a 5% significance level.
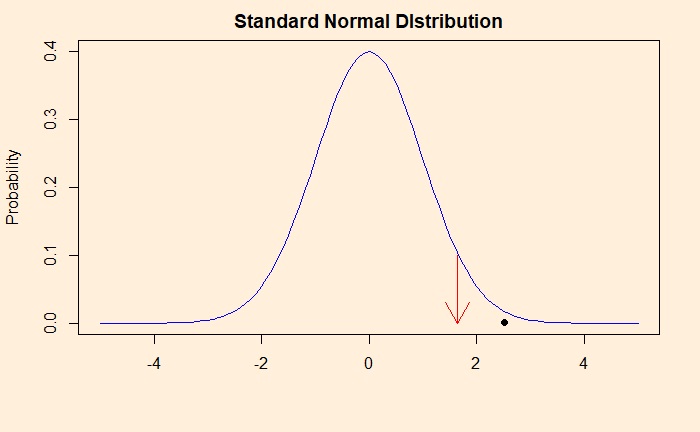
As per the formula, Z = (58-54)/(10 x sqrt(40))= 2.53. Now compare the position of 2.53 in a standard normal distribution, the assumption we made for the Z-statistic. The location of 2.53 is marked as a black dot in the plot below, and the start of the critical region (> 95% or <5%), by the red arrow.

So what is the p-value here? The probability that we observe a z-statistic 2.53 and above, given the null hypothesis. In other words, p is the area under the curve above the value 2.53. You can get that using the R function, pnorm (The function pnorm returns the integral from -infinity to q of the normal distribution where q is a Z-score.) and subtracting it from 1 (the total integral from -infy to +infy). The value of p is 1 – pnorm(2.53) = 1 – 0.9943 = 0.0057.
Farmer’s data has only a 0.57% chance to stand with the null hypothesis. So we reject the null hypothesis and accept the notion that the farmer’s eggs are heavier than the national average.

