The concept of p-value is one complicated setting in statistics. As per the renowned writer, cognitive psychologist, and intellectual Steven Pinker, 90% of psychology professors get it wrong! Where did he get this 90%? Well, my default position (the null hypothesis) is that Steven Pinker is a no-nonsense writer. So, I confidently take 90% as my prior. I also find it super confusing (how is it relevant in a statistical setting?).

Two people are playing a game of rolling dice. One person suspects that the die was faulty, and the other (as always!) is getting too many 6s. To test the assumption, they decide to roll it 100 times. The result was 22 sixes. Since the probability of getting a six is (1/6), and the number of rolls was 100, she argues, the expected number of sizes was 16.6. Since they got 22 sixes, the die is defective.
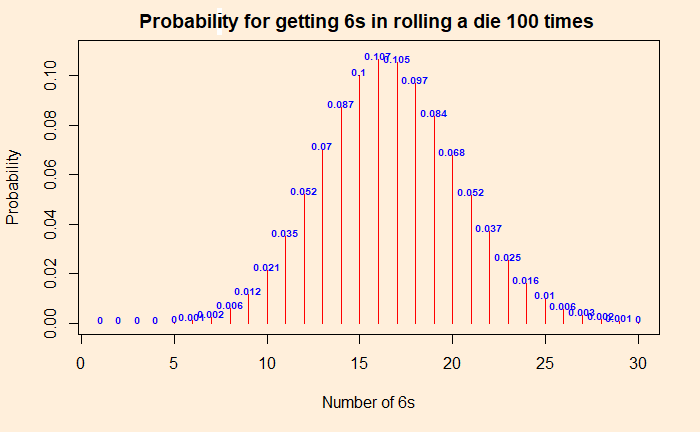
By now, we know that the above argument was wrong. It is not how probability and randomness work. The experiment is equivalent to independent Bernoulli trials with the following distribution of chances for each number of sixes. Let the force of “dbinom” be with you and get the probability distribution. Probabilities for the “dbinom” are (1/6) for success and (5/6) for failure (not a 6).

The proper way
You got to start with a hypothesis. Since statisticians are statisticians and wanted to maintain a scientific temper, they created a concept called the null hypothesis as the default. Here the null hypothesis is: that the die is fair and will follow the binomial distribution as shown in the plot above. If you want to prove the die is defective, you need to demonstrate the null hypothesis to be invalid and reject it.
Proving beyond doubt
We have to prove that getting 22 sixes is within 5% of the most extreme values the dice can give in 100 rolls. Why 5%? It is just a convention and is called the significance level. We define the p-value and have to prove that it is smaller than or equal to the significance level to reject the null hypothesis (or prove your point). Else accept the null hypothesis (and acknowledge that you are unsuccessful).
Enter p-value

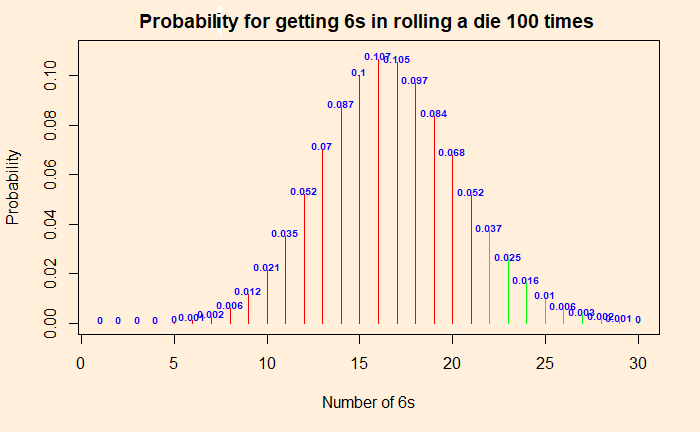
The p-value is the probability of getting numbers at least as extreme as 22. At least as extreme as 22 means: chance of getting 22 + chances of getting anything more extreme than 22! So it is the sum of 0.037 + 0.025 + 0.016 + 0.01 + 0.006 + 0.003 + 0.002 + 0.001 = 0.1 = 10%. The p-value is 10%. This is more than the significance level of 5%, and therefore we can’t reject the null hypothesis that the die is good. No evidence. To repeat, if you do the same experiment 100 times over and over, you may get 22 or more 6s one out of 10 times. To prove the die is faulty, it must reduce to one in 20 (or lower).
P for Posterior
The significance test through p has a twisted logic. p is the probability for my data given the (null) hypothesis. In other words, while you intend to prove your point, the world (or science) wants to compare it with its default, null hypothesis. The smaller the chance, you win, and the prior gives way to the posterior. My theory wins because the data collected was unlikely if the null hypothesis is true.
Tailpiece
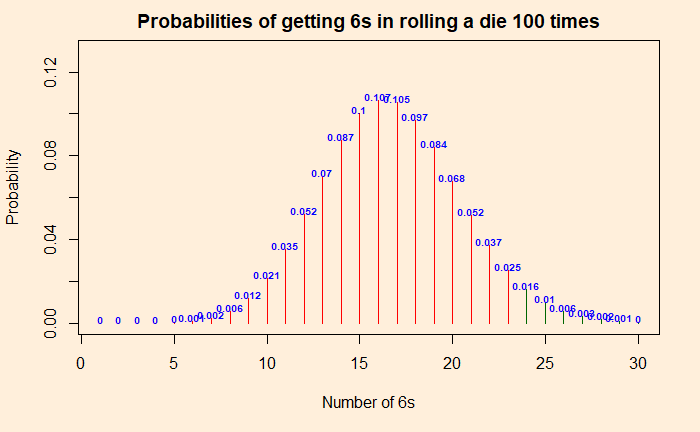
Going to more extreme values, you will see that the probability of getting 24 or more times 6 is less than 5%. So if you throw 6s 24 or more times, you are in the critical region, and you can prove the die is faulty.

Typically, a p-value below 0.01 signifies strong evidence, 0.05 – 0.01 is moderate, and 0.05 – 0.1 is weak evidence against the null hypothesis in favour of the alternative. p greater than 0.1 is considered as no evidence against the null hypothesis.
Steven Pinker: Rationality: What It Is, Why It Seems Scarce, Why It Matters

