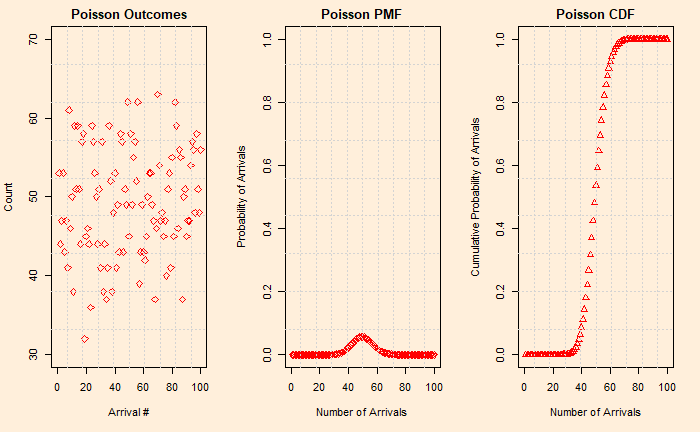
Take the example of this shopping mall that attracts about 6000 customers daily, between 10 AM and 8 PM. The shop manager wants to know the probability of 50 customers visiting the shop between 12:00 and 12:05 next Monday. How do you do it?
One way is to divide the time into several small intervals and do Bernaulli (binomial) trials at each interval using an average probability of someone arriving during that interval based on historical data. How do you divide the time – into hours, minutes or seconds? It seems a very laborious process.
Instead of dividing time into compartments and running Bernoulli trials for each of those intervals, what about taking the time-averaged visitors and estimating expected numbers for the given interval? This method of collecting timestamps instead of recording counts at regular intervals is the strength of the Poisson (/ˈpwɑːsɒn/)distribution. It is still a discrete distribution for the outcome still counts, but its time dimension is a continuum.
We do the same process that we did last time. Following are the event, PMF and CDF of the Poisson process.

The R code required to generate the above plots is below. Please take special note of the three special functions – rpois, dpois and ppois.
trial <- 100
xxx <- seq(1,trial)
lambda <- 10


par(bg = "antiquewhite1", mfrow = c(1,3))
plot(rpois(trial, lambda), xlim = c(0,100), ylim = c(0,25), xlab="Arrival #", ylab="Count", col = "red", cex = 1, pch = 5, type = "p", bg=23, main="Poisson Outcomes")
grid(nx = 10, ny = 9)

plot(dpois(xxx, lambda), xlim = c(0,20), ylim = c(0,1), xlab="Number of Arrivals", ylab="Probability of Arrivals", col = "red", cex = 1, pch = 5, type = "p", bg=23, main="Poisson PMF")
grid(nx = 10, ny = 9)

plot(ppois(xxx,lambda, lower.tail=TRUE), xlim = c(0,20), ylim = c(0,1), xlab="Number of Arrivals", ylab="Cumulative Probability of Arrivals", col = "red", cex = 1, pch = 2, type = "p", bg=23, main="Poisson CDF")

grid(nx = 10, ny = 9)
Now to answer the manager’s question.
The shop receives 6000 customers daily, i.e. an average of 50 customers every 5 minutes. It implies a Poisson function with an expected value (lambda) of 50. So what is the chance of 50 people arriving in a 5 min interval on a future day? It is dpois(50, lambda) = 5.5%

