FiveThirtyEight (538) is a website based in the US that specialises in opinion poll analysis. They lead the art of election prediction, especially the US presidential, through poll aggregation strategy.
Let us look at a poll aggregator methodology and how it forecasts better than individual pollsters. Take the 2012 US presidential election, in which Obama won against Mitt Romney by a margin of 3.9%. We approach it through a simplistic model and not necessarily what 538 might have done.
Assume Top-Rated Pollsters Got It Right
Let’s try and build 12 poll outcomes that came in the last week before the election. The sample sizes of each of these polls are 1298, 533, 1342, 897, 774, 254, 812, 324, 1291, 1056, 2172 and 516 – a total of 11269 (remember that number). We don’t know anything about the details of voter preference, but we assume all the posters got it right – the 3.9% margin.
Since we don’t have any details, we simulate the survey, starting with the first pollster, 1298 samples. The following R code gives preference to 1298 people with an overall 4% advantage for Obama over Romney.
sample(c(0,1), size = 1298, replace = TRUE, prob = c(0.48, 0.52))The code mimics choosing 1298 items from an urn containing a large number of balls having two colours, one being more prevalent than the other by a 4% chance.
Now, we follow the step-by-step procedure as we did before
- Number of samples – 1298
- Calculate the mean – In one realisation, I get 0.534
- Calculate the standard deviation and divide by the square root of the sample size. It’s 0.499/√1298 = 0.0139
- Take a 95% confidence interval and assume a standard normal distribution. (0.534 – 1.96 x 0.0139) and (0.534 – 1.96 x 0.0139). 0.50 and 0.56.
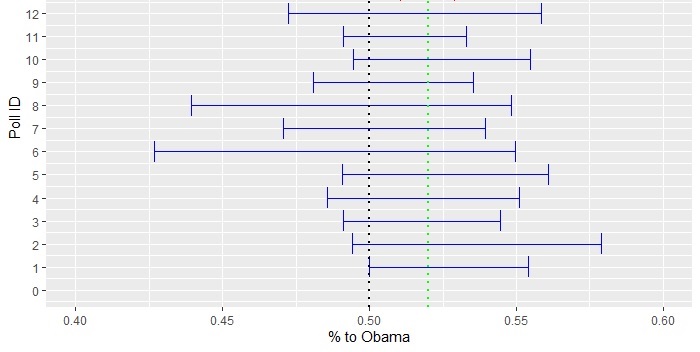
Repeat this for all the pollsters using their respective sample sizes but at a constant 4% margin on the win. One such realisation of all the 12 poles is presented below in the error plot.

Two features of the error bars are worth noting. First, the actual outcome, 0.52, is covered by every pollster. Second, all of them covered the toss-up (a crossing over 0.5) scenario. While the first point is expected 95% of the time (by definition), the second one is more frequent for surveys with fewer participants.
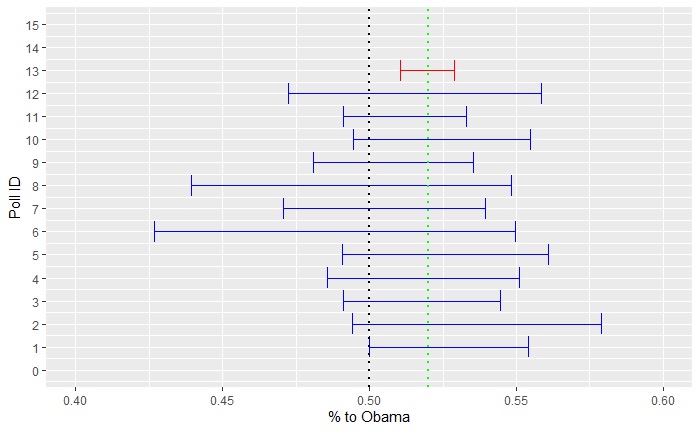
Now, use the aggregator technique. Suddenly, you have 11269 samples available. Repeat all the steps above, and you get, in realisation, 0.51 and 0.53. Include that in the main plot (red error bar), and you get the following:

For the aggregator, the confidence interval no longer covers a toss-up.
Advantages of Aggregator Strategy
The strength lies in the increased sampling size available to the aggregator. They also get the opportunity to select surveys that are known to be representative. For example, 538 provides a grading scheme to rate the quality of pollsters.
Introduction to Data Science: Rafael Irizarry

