We have seen Weibull before. It is a continuous probability distribution that finds applications in various fields, such as engineering and reliability analysis. It is because of the flexibility to adapt to different shapes: uniform, left, or right-skew.
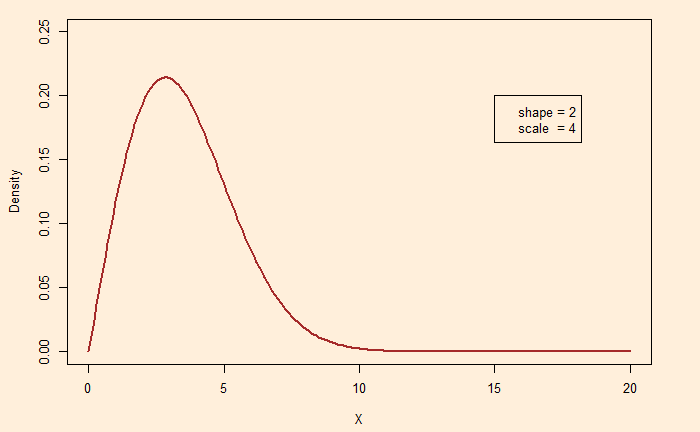
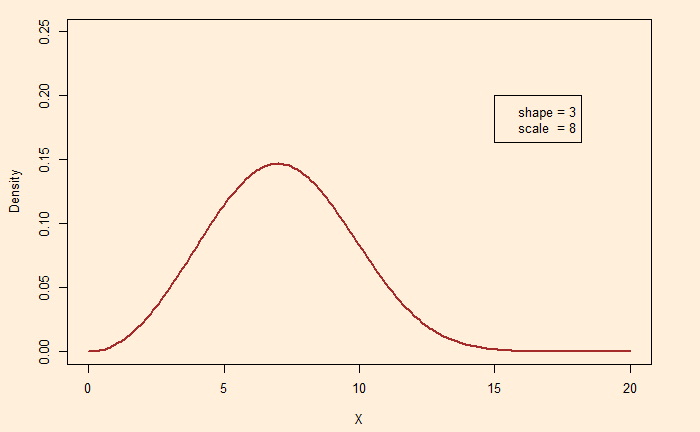
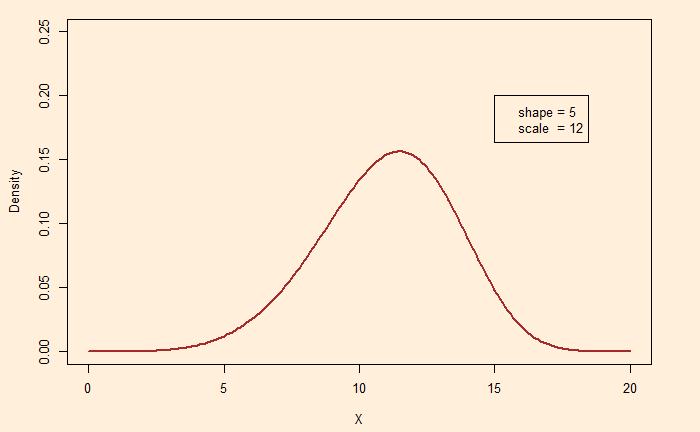
The shape and scale are the names of two typical parameters in a Weibull distribution. Depending on their values, one can get shapes such as:
Shape between 1 and 2.6: Right-skewed
xx <- seq(0,20, 0.1)
plot(xx, dweibull(xx, shape = 2, scale = 4))
Shape ~ 3 Uniform

Shape > 3.7 Left-Skewed

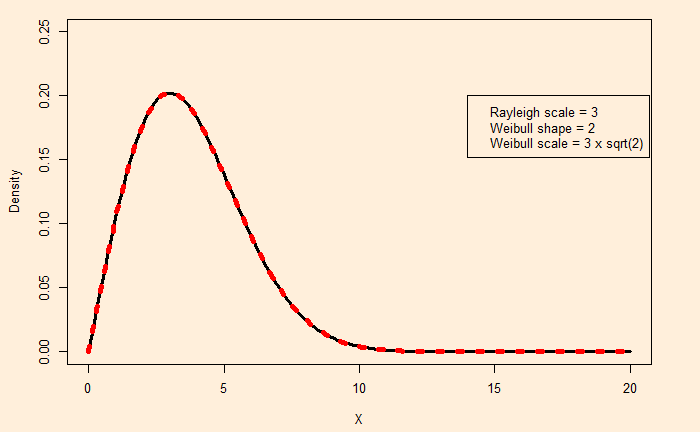
The Rayleigh distribution is a special case of the Weibull distribution. Rayleigh has one parameter, namely the scale. If The Rayleigh scale parameter is A, the corresponding Weibull has a scale = sqrt(2)xA and shape = 2. Here is a comparison between Rayleigh and Weibull for a Rayleigh scale= 3.
xx <- seq(0,20, 0.1)
plot(xx, drayleigh(xx, scale = 3), type = "l", ylim = c(0,0.25), lwd = 3, xlab = "X", ylab = "Density")
lines(xx, dweibull(xx, shape = 2, scale = sqrt(2)*3), type = "l", ylim = c(0,0.25), col = "red", lwd = 5, lty=3)
Here, Black represents the Rayleigh and red the Weibull.

