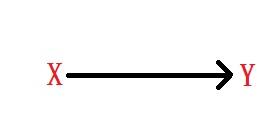
A causal diagram is a graphical representation of the relationship between variables. For example, the picture below describes a probability rule specifying how Y changes if X changes.
Back-door path
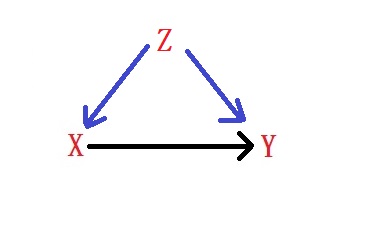
Is any path from X to Y that starts with an arrow pointing to X. Here is an example with a back-door path (X <- Z -> Y)
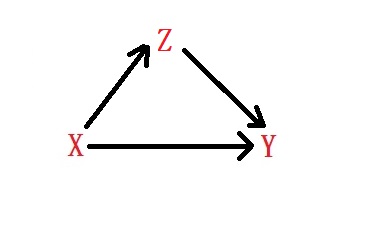
Whereas the picture below has no back-door path
Confounder
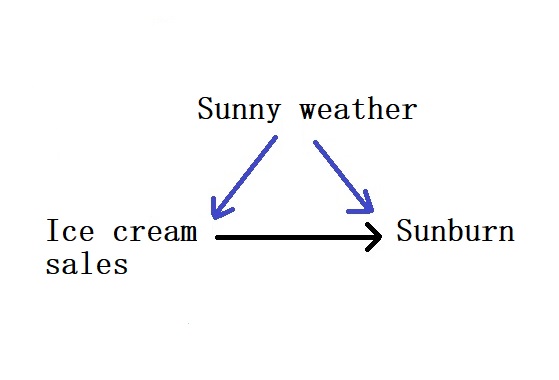
We know what a confounder is, and it is an example of a back-door path. The most famous example is the relationship between sunburn and ice cream sales! The data may show sunburn increases with ice cream sales. In contrast, the proper interpretation requires a back-door path in which a confounder, sunlight, causes both an increase in ice cream sales and sunburn.
Mediator
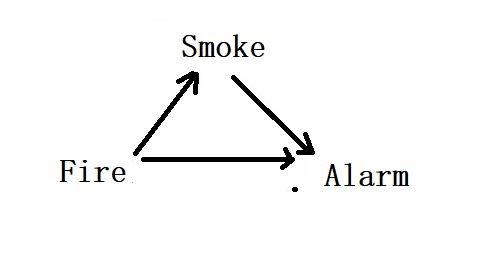
An example of a mediator is the case of an alarm for fire hazards. Here, smoke is a mediator; when a fire happens, the detector detects the smoke and sets off the alarm.
