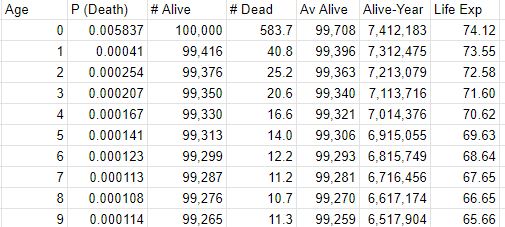
The period-life expectancy at a given age is the average remaining number of years expected for a person at that exact age, estimated from the mortality rate of that particular time. Let’s work out the calculation using the death probability (probability of dying within one year) table. The death probability is estimated from the mortality rates at each age (from census data for a short period). Here are the first few lines of the data (for complete data, see reference).
| Age | P (Death) |
| 0 | 0.005837 |
| 1 | 0.00041 |
| 2 | 0.000254 |
| 3 | 0.000207 |
| 4 | 0.000167 |
We start with 100,000 people in the cohort. The number of deaths in a given year, Yx = the probability of death (in Yx) x people alive (in Yx). In our example, for Y1, it is 100,000 x 0.005837 = 583.7.
The number of people alive in the next year (Yx+1 ) = people alive (in Yx) – the number of deaths in a given year (x). I.e., # Alivex+1 = 100,000 – 583.7 = 99,416. This number multiplied by the probability gives the number of dead in Yx+1.
The next step is to calculate the average number of people alive in the age category. It can be calculated as a mid-point average of the number of people in Yx+1 + (1/2) of the death in Yx. That equals 99,416 + 0.5 x 583.7 = 99,708.
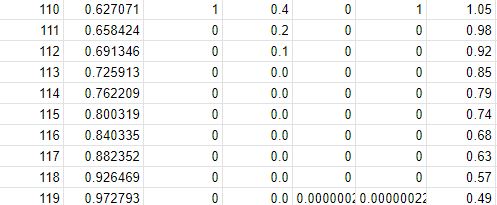
In the next step, the total number of person-years lived by the cohort from age x until all cohort members have died. It is the sum of the numbers in the mid-point average column from age x to the last row in the table. Suppose there are a total of 120 columns (age numbers), and you want to calculate the person-years of age 24, you add all average alive from Y24 till Y119.
Life expectancy for a given age = person-years / persons alive.
Here are the first and the last 10 years of calculations of a table that has 120 rows (Y0 – Y119).


References
Actuarial Life Table: SSA
The Life Table: lifeexpectancy.org

