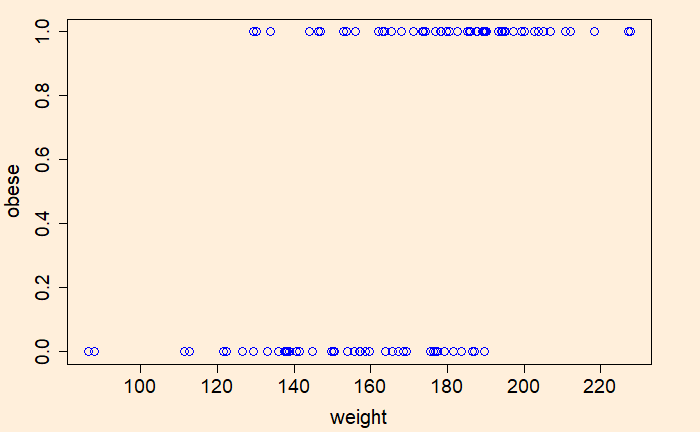
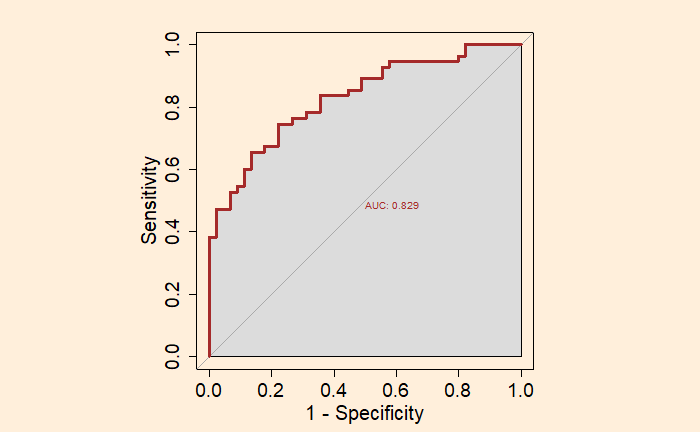
We’ll demonstrate the concept of ROC (Receiver Operating Characteristics) and AUC (Area Under Curve) with the help of (simulated) weight data and using R codes. Here are the first ten rows of the data.
weight       obese
86.48505	0
88.04764	0
111.50064	0
112.69730	0
121.53974	0
122.34533	0
126.53330	0
129.34565	0
129.46268	1
130.17398	1
Here ‘obese’ is the outcome variable that takes one of the two values, 0 (not obese) or 1 (obese). The ‘weight’ is the independent variable, also known as the predictor.

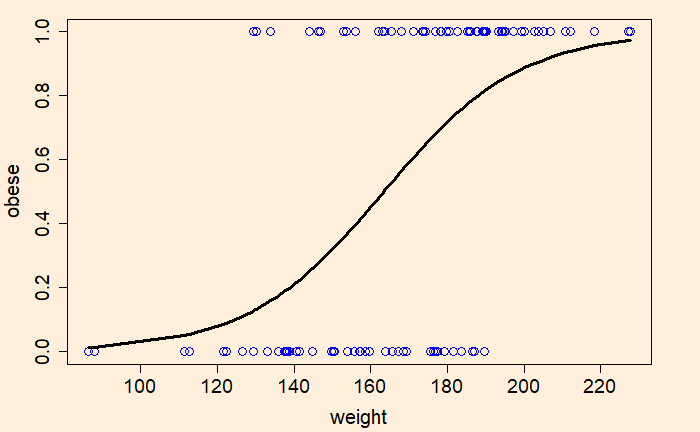
Now, we’ll do logistic regression of the data using the generalised linear model (‘glm’), store the output in a variable and plot.
plot(weight, obese, col = "blue", cex  = 1.5,  cex.axis = 1.5, cex.lab = 1.6)
glm.fit <- glm(obese ~ weight, family = "binomial")
lines(weight, glm.fit$fitted.values, lwd = 3)
Estimation of ROC and AUM requires the package, ‘pROC’.
par(bg = "antiquewhite1", pty = "s")
roc(obese, glm.fit$fitted.values, plot = TRUE, legacy.axes = TRUE, col = "brown", lwd = 3, print.auc = TRUE, auc.polygon = TRUE)
We used the following options to get the final plot.
par(pty = “s”); for plotting the graph as a square
plot = TRUE; for plotting the graph
legacy.axes = TRUE; for plotting 1- specificity on the x-axis instead of the default specificity
print.auc = TRUE; to print the value of AUC on the graph
auc.polygon = TRUE; to present AUC as a shaded area.

