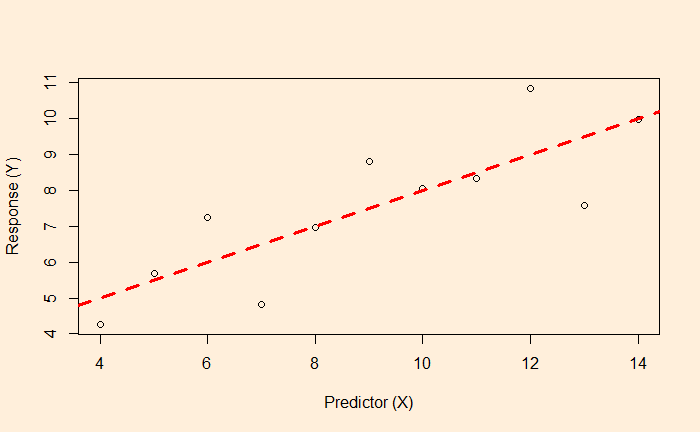
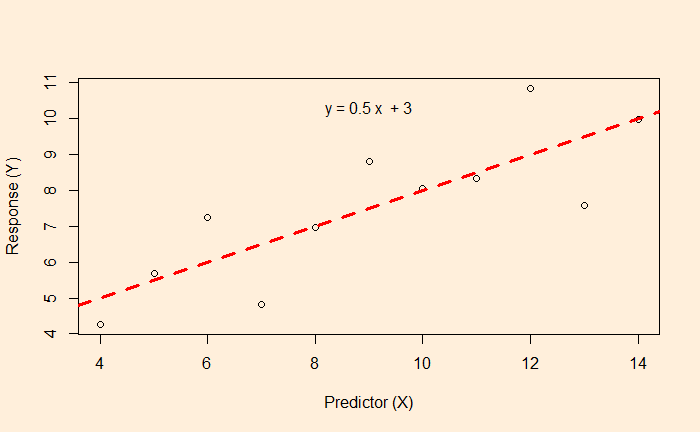
We know linear regression, which allows us to find the relationship between two variables and let us predict a dependent variable from an independent variable.

In this example, the function associated with the red dotted line lets us estimate the fat% if a BMI value is known.

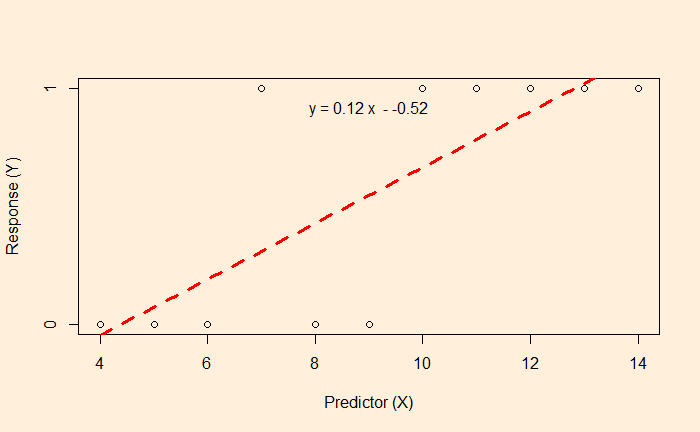
But what happens if the data is available, like the following?

Here, the survey gives either a YES or NO as the answer (1 = YES, 0 = NO). The linear regression and the subsequent equation are meaningless here. In such cases, we resort to logistic regression.
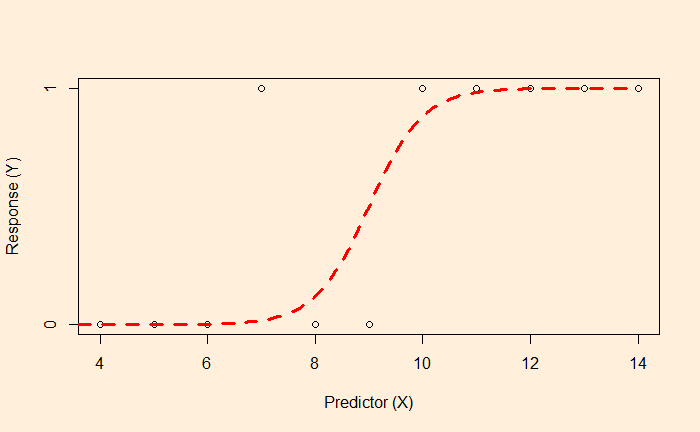
The objective of the logistic regression is not to get the value of Y but the probability. E.g., if the X value is 9, there is a 50% chance of getting a YES. On the other hand, X = 2 has a higher probability of getting a NO.

The plot tells you that the data is best suited for classification. Ys with < 50% chance to occur will be classified as the YES category, and < 50% is in NO.

