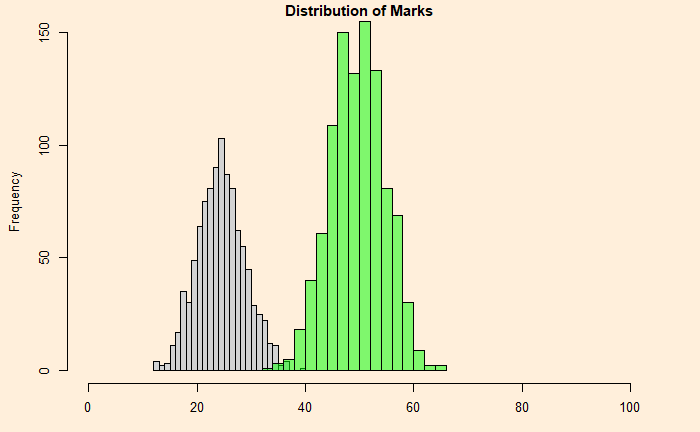
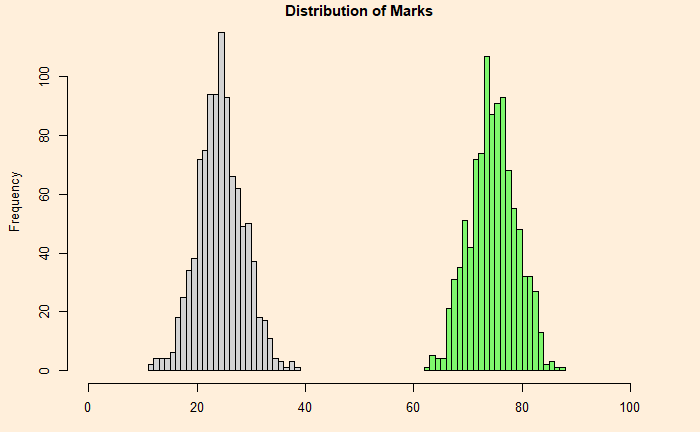
Think about it: a person attempts randomly to answer 100 multiple-choice questions – one correct answer out of four choices. What is the expected mark? Well, the first instinct could be 25. There are 100 questions, and the person who decides to attempt randomly has a one in four chance to get it right (1/4) x 100 = 25. Well, that’s an average, although, in reality, it follows a range.
Let’s run the following code to find out one such scenario.
itr <-1000

mark <- replicate(itr, {
sum(sample(c(1,0), 100, replace = TRUE, prob = c(1/4,3/4)))
})

min(mark)
max(mark)
The output gives 12 and 40 (it will change once you repeat the calculation for randomness.
Now, we repeat the simulation with someone better at recognising the answer, i.e., a 50:50 chance of getting it right. Again, run 1000 individual runs and compare the distribution.

An extreme case is a comparison of the random with someone with 75% certainty about the answers.


