McKinsey curve is a global mapping of opportunities that can reduce GHG emissions and is quite influential among policymakers. These are GHG abatement curves estimated at a future period for different countries. Following is an illustration of how they appear (for getting the actual curves, follow the link in the reference).
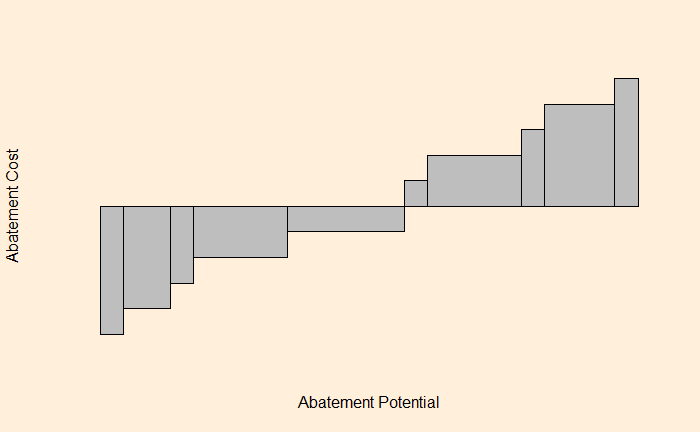
For an economist, it is a supply curve or the map of the marginal cost of making the marginal unit. Or the cost of reducing that last ton of greenhouse gas emissions. And each block represents one item – residential lighting, cellulosic biofuel, onshore wind, and coal power plant with CCS, to name a few.
Take one block, say the residential lighting: its width represents how many fewer greenhouse gas emissions we would have if we optimize the residential lighting system. The height is how much would that cost ($/ton CO2) to the households. If it is negative, it suggests the family gains money.
Most items on the negative side (the left side) are related to energy efficiency. And, by the definition of efficient markets, should happen by default, like changing CFL lamps with LED. But it’s a different matter altogether that these don’t always happen that way. But what is the idea of getting everything done on the list? From an economist’s standpoint, add a carbon tax larger than the height of the highest block on the right side. It becomes cheaper to perform abatement in that sector than pay taxes.
Reference
McKinsey Curve

