Having seen the probability of winning the lottery picks in the NBA, it would be interesting to see how fortune has favoured the teams historically. Last year (2022), the top four went to, respectively, Magic (2nd), Okc (4th), Rockets (1st) and Kings (7th). So, the number 7 got a lift of 3 places and reached inside top 4. It’s a coincidence that the 7th team has been in the lottery pick every year since 2018! Well, the odds of the 7th team getting inside the lottery (top 3 then) had been 16% in 2018 and 32% since then.
But how many times the first draw has gone to the top 1 team (i.e., the last one of the regular season)? Here is the graph summarising the statistics from 1985 through 2022.
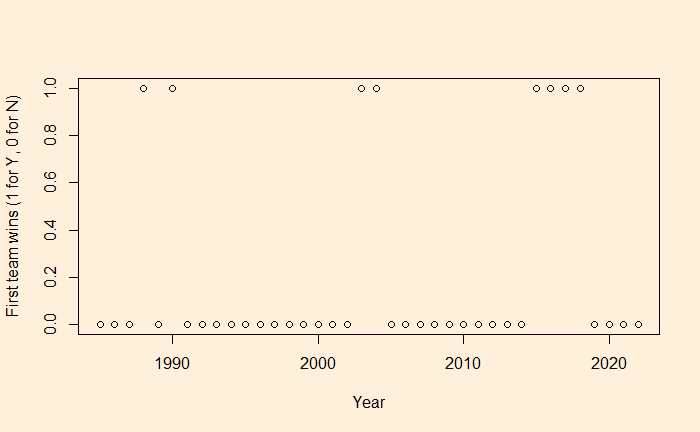
Here ‘1’ means if the first team got the first pick and ‘0’ otherwise.
Note that the probability for the first team to come first in the lottery has changed over the year – 14.29 in the first four years, followed by 11.11 for a year, then 16.7, 25 for a long time until the latest 14% since 2019. Considering all these, the average probability of winning first is 21.48%. And the eight winners in the last 38 years suggest the actual data stands at 21%!
In 1993, the Orlando Magic got the first pick, whereas its pre-lottery chance was merely 1.52%. Similar things happened in 2008 (1.70%, Chicago Bulls) and 2014 (1.70%, Cleveland Cavaliers). The Cavaliers have more instances of luck, where they got Kyrie traded from the Clippers in 2011, where the latter had a 2.8% chance to win the first draw, and the ultimate price, Lebron James in 2003, where they were indeed the first one on the list!
References
NBA Draft Lottery History: Real GM
Tanking Won’t Die in the New NBA Draft Lottery System: The Ringer
NBA Draft Lottery: NBA
Top 5 NBA Draft Lottery Miracles: NBC

