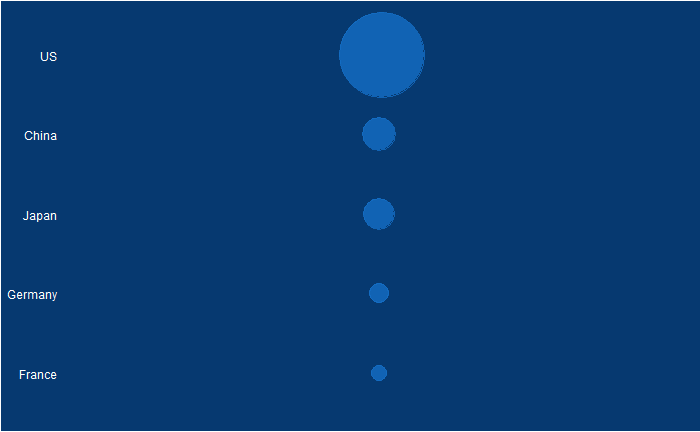
Political pitches are notorious for exaggerating facts. One example is the 2011 state of the union address of then-US President Obama. Here, he created a visual illusion using a bubble plot in the following form to represent how America’s economy compared with the rest of the top 4. Note what follows here is not the exact plot he showed but something I reproduced using those data.

Doesn’t it look fantastic? The actual values of GDP of the top 5 in 2010 were:
| Country | GDP (trillion USD) |
| US | 14.6 |
| China | 5.7 |
| Japan | 5.3 |
| Germany | 3.3 |
| France | 2.5 |
The president used bubble radii to scale the GDP numbers, which is not an elegant style of representation. It is because the area of the circle and the perspective it creates for the viewer squares with the radius. In other words, if the radius is three times, the area becomes nine times.
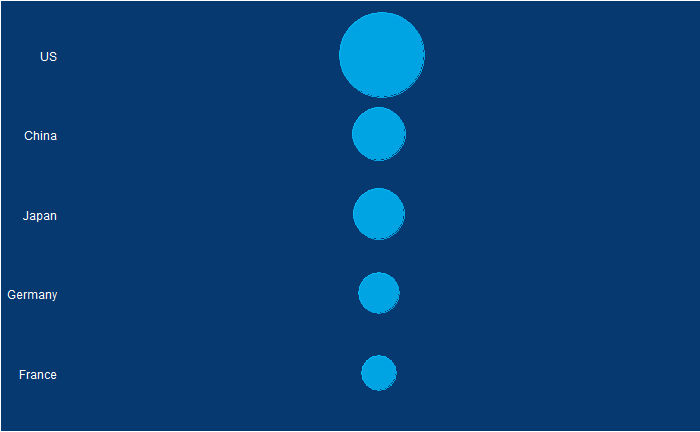
What would have been a better choice was to use the radius for scaling the bubble.

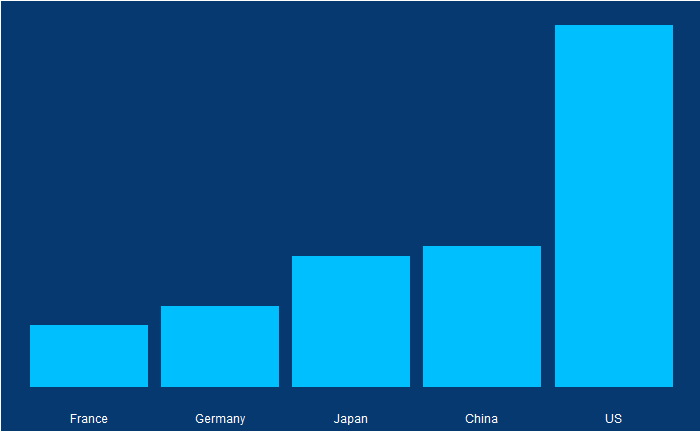
Or use a barplot.

Reference
The 2011 State of the Union Address: Youtube (pull up to 14:25 for the plot)

