Let’s revisit something that we touched upon some time ago – the topic of observation theory. For those who don’t know what it is, the observation theory is about estimating the unknowns through measurements.
While the unknowns, the parameters of interest could be deterministic, such as the height of a mountain, or the temperature rise, the measured values are random or stochastic variables. And two terms that represent the quality of the observations are precision and accuracy.
Precision
Precision means how close repeated measurements are to each other. As an illustration, the following are 100 data points from a measurement campaign.
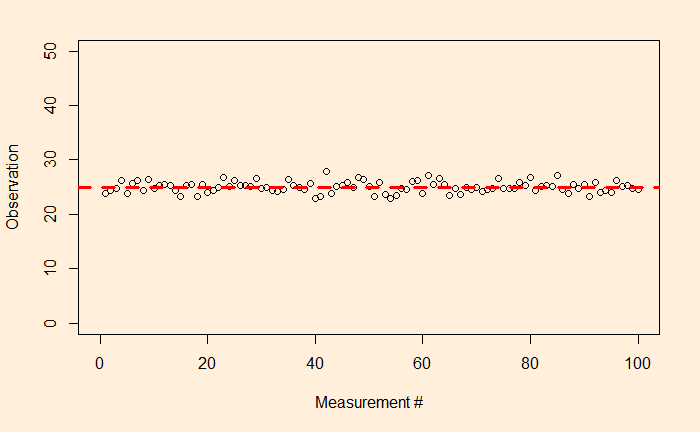
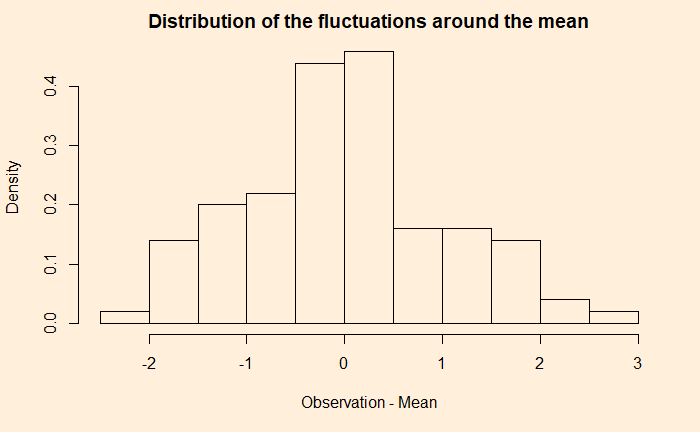
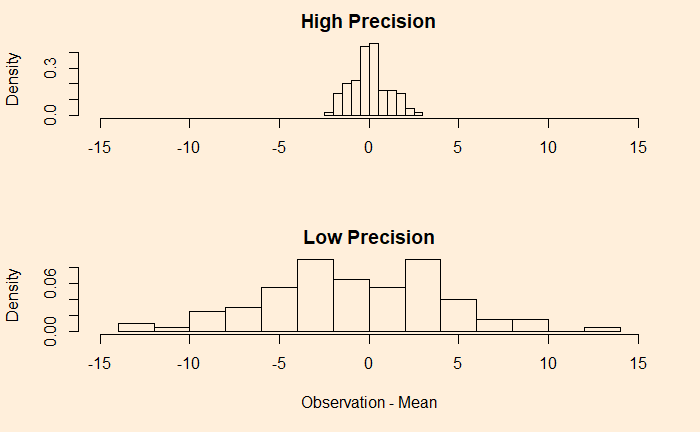
The dotted red line represents the mean (= 25). The fluctuation around the mean can be calculated by subtracting 25 from each observation. Here is how the fluctuations are distributed.
Now, look at another example.
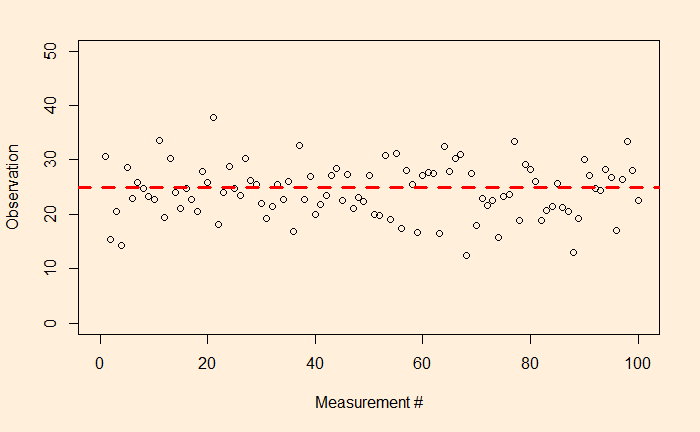
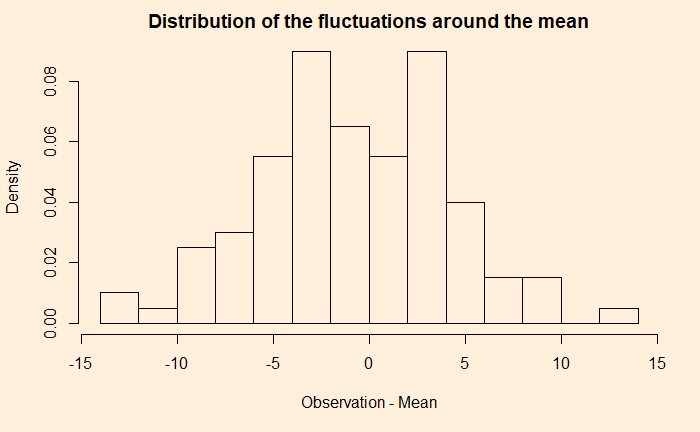
A comparison of the two examples shows that the first one has a narrower distribution of errors (higher precision), and the second one has broader (lower precision). But they both follow a sort of normal distribution around mean zero.
We’ll discuss accuracy in the next post.

