Another world championship for football is coming to a close, as the final match is scheduled for tomorrow. Getting a penalty kick, either inside the game or at a tie-breaker stage, is considered a sure-short chance to make the all-important goal for the team. Today we look at how teams have managed spot kicks (a.k.a. penalty kicks) in the world cup (from Spain in 1982 to Russia in 2018).
The data is collected from kaggle.com (WorldCupShootouts.csv). We use R to perform the step-by-step analysis. First, the data:
library(tidyverse)
Spot_data <- read.csv("./WorldCupShootouts.csv")
Spot_data <- na.omit(Spot_data)
as_tibble(Spot_data)
A tibble:279 x 9
Team Zone Foot Keeper OnTarget Goal
BRA 7 R L 0 0
FRA 7 R R 1 1
GER 1 L R 1 1
MEX 6 L L 1 1
GER 8 L L 1 1
MEX 8 R L 1 0
GER 7 R L 1 1
MEX 7 R L 1 0
GER 4 R L 1 1
SPA 7 R R 1 1
...
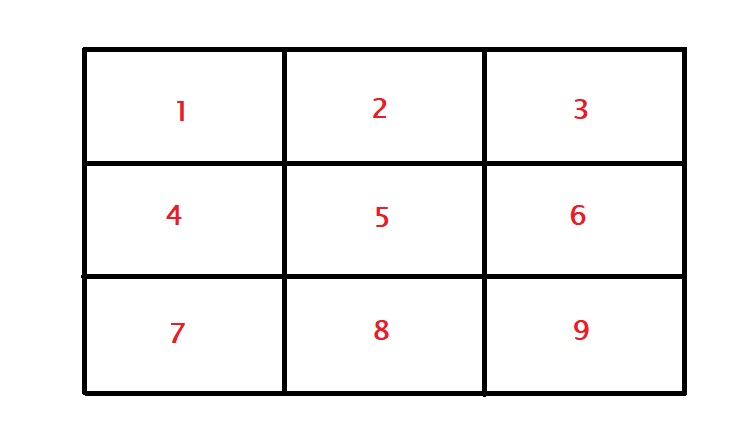
21-30 of 279 rowsThe first meaningful data in the table is the column Zone, which represents which part of the goalpost (from the viewpoint of the player who takes the kick). The figure below shows all the zones. For example, zone 7 represents the bottom right side of the goalkeeper, 3 is the top left side of the goalkeeper etc.

The two other variables we will use in this analysis are – Ontarget: 1 = on target, 0 = off target, goal: 1 = goal, 0 = no goal.
The probability of scoring a penalty
There are many ways to calculate that – add a filter to the column, goal, = 1, and divide the term by the total number of attempts. We use something simple – the which function.
nrow(Spot_data[which(Spot_data$Goal == 1),]) / nrow(Spot_data)The answer is 0.698; there is a 70% chance (prior) of scoring from a penalty.
Where to hit?
Ignore various zones for a moment and focus on the top, middle or bottom of the frame.
top <- Spot_data$Zone == 1 | Spot_data$Zone == 2 |Spot_data$Zone == 3
mid <- Spot_data$Zone == 4 | Spot_data$Zone == 5 |Spot_data$Zone == 6
low <- Spot_data$Zone == 7 | Spot_data$Zone == 8 |Spot_data$Zone == 9
# '|' means 'OR'
For the top section,
nrow(Spot_data[which(Spot_data$Goal == 1 & top),]) /
  (nrow(Spot_data[which(Spot_data$Goal == 1 & top),]) +
     nrow(Spot_data[which(Spot_data$Goal == 0 & top),]))
we have a 0.73 (73%) probability of scoring a goal. Run the code for the middle and bottom, and you get 72% and 67%, respectively. We will look at the significance of these differences at another time.

