It is world cup season. The world championship for football, or soccer to some, arguably one of the world’s most popular sports spectacles, is happening now in Qatar. On the eve of the start, the prestigious science journal, Nature, published an article on the importance of data science to football’s evolution to its current state.
At the end of the paper, the authors quote a prediction table based on a double Poisson model that predicted the 2020 European championship with reasonable accuracy.
Here, we “cherry-pick” one of the teams, Belgium, which failed to qualify for the knock-out stages, nonetheless the top-billed squad by the model and estimate the possibility of them qualifying from the preliminary stages.
The model estimate Belgium to have 13.88% of winning the cup, followed by Brazil at 13.51. So, we estimate that if Belgium reached the tournament’s final, it would have a 13.88/(13.88+13.51) = 50.7% chance of winning. Therefore,
The chance of winning the cup = probability of reaching the final (P1/2) x probability of winning the final.
P1/2 = 0.1388 / 0.507 = 0.27 (27%).
Extending the argument further, P1/4, the probability of Belgium in the semi-finals is, P1/4 = 0.27/(13.88/(13.88+11.52)) = 0.5.
P1/8 = 0.5/(13.88/(13.88+5.29))= 0.69.
P1/16 = 0.69/(13.88/(13.88+0.69)) = 0.72.
So, Belgium had a 28% chance of not qualifying for the playoffs, and it happened that way! Note that the chances, 11.52, 5.29 and 0.69, are taken from the same table as the winning chances of the 4th, 8th and 15th teams.
Making it broader
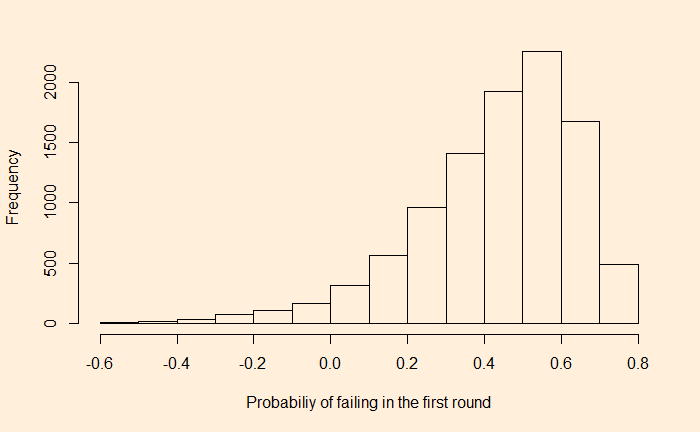
Here we have assumed that Belgium met Brazil (winning probability = 13.51), Argentina in the second (11.52%) etc. In reality, we don’t need to make such assumptions. Let’s consider an extreme case, which is also not possible as the qualifying teams go via a narrow path forward, where any team in the top 15 could meet Belgium in each round. We run a Monte Carlo with the following code.
nn <- 10000

sec_round <- replicate(nn, {
 round <- sample(c(0.1351, 0.1211, 0.1152, 0.0965, 0.0724, 0.0637, 0.0529, 0.0378, 0.0336, 0.0317, 0.0256, 0.0233, 0.0146, 0.0067), 4, replace = FALSE)

P_1 <- 0.1388
P_12 <- P_1/(P_1/(P_1+round[1]))

P_14 <- P_12/(P_1/(P_1+round[2]))

P_18 <- P_14/(P_1/(P_1+round[3]))

P_116 <- P_18/(P_1/(P_1+round[4]))

1 - P_116
})
And the answer is in the following histogram.

I must say that the analysis is meant for fun, with hardly any speck of reality in it. Since the calculations are done in reverse, the conclusions don’t prove that a team with the highest (13.88%) chance to win the cup will go out from the first round with a 40% probability. On the contrary, it only states that even a team with only a 60% chance to reach the second round can still have a 13.88% chance to win!
Reference
How big data is transforming football: Nature
Double Poisson model for predicting football results: Plos One

