We have seen how samples from almost any distribution, provided you collected enough for the average, eventually make Gaussian, which is the Central Limit Theorem (CLT). We also see the futility of that assumption when dealing with asymmetric distributions such as the Pareto; ‘enough for the average‘ never happens with any practical numbers of sampling.
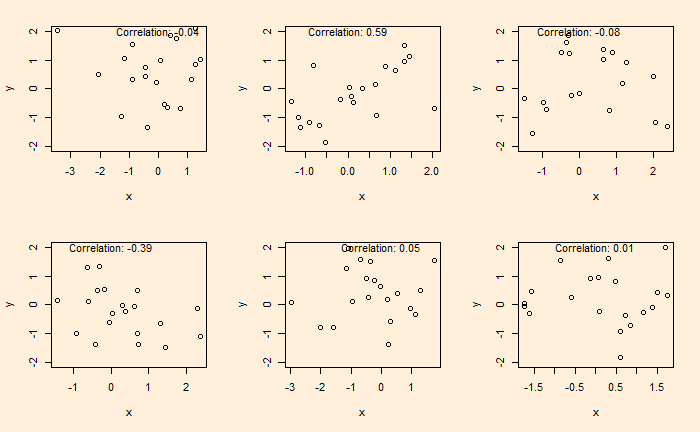
Once we assume that all samples obey CLT (which is already not a correct assumption), we start collecting data and finding out relationships. One of the pitfalls many researchers fall into is inadequate quality assurance and mistaking randomness as correlations. Here is an example. Following are six plots obtained by running two sets of standard normal distributions for random numbers (20 each) and plotting them on each other.

The plots are generated by running the following codes a few times.
x <- rnorm(20)
y <- rnorm(20)
plot(x,y, ylim = c(-2,2))
text(paste("Correlation:", round(cor(x, y), 2)), x = 0, y = 2)
A nice video on this topic by Nassim Taleb is in the reference. Note that I do not support his views on sociologists and psychologists, but I do acknowledge the fact that a lot of results generated by investigators are dubious.
Fooled by Metrics: Taleb

