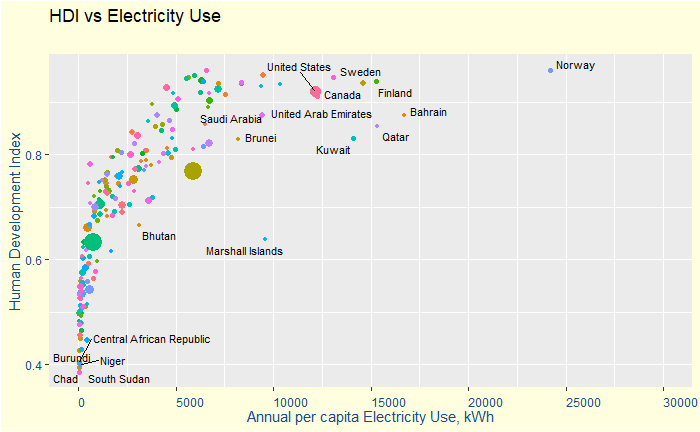
Today, let’s look at the relationship between the human development index and per capita electricity consumption.

The data was acquired from Wikipedia by web scraping using an R program. The codes used for the extraction, conditioning and plotting are provided below.
# Packages required
library(xml2)
library(rvest)
library(tidyverse)
library(ggrepel)


#Web scraping of data
url <- "https://en.wikipedia.org/wiki/List_of_countries_by_electricity_consumption"
page <- read_html(url) #Creates an html document from URL
table_energy <- html_table(page, fill = TRUE) #Parses tables into data frames

url <- "https://en.wikipedia.org/wiki/List_of_countries_by_Human_Development_Index"
page <- read_html(url) #Creates an html document from URL
table_hdi <- html_table(page, fill = TRUE)

#clean-up
hdi_countries <- as.data.frame(table_hdi[2])
ene_countries <- as.data.frame(table_energy[1])

hdi_countries <- hdi_countries %>% select(Nation, HDI)
ene_countries <- ene_countries %>% select(Country = Country.Region, Elec = `Total.electricityconsumption.GW.h.yr.`, Population, PCElec = `Average.electrical.power.per.capitaexpressed.in`)

hdi_countries <- hdi_countries[-1,]
ene_countries <- ene_countries[-2:-1,]

ene_hdi <- merge(hdi_countries, ene_countries, by.x="Nation", by.y="Country")
ene_hdi$HDI <- as.numeric((gsub(",", "", ene_hdi$HDI)))
ene_hdi$Elec <- as.numeric((gsub(",", "", ene_hdi$Elec)))
ene_hdi$Population <- as.numeric((gsub(",", "", ene_hdi$Population)))
ene_hdi$PCElec <- as.numeric((gsub(",", "", ene_hdi$PCElec)))

#plotting
ggplot(ene_hdi, aes(x=PCElec, y=HDI)) +
  geom_point(aes(size = Population, colour = Nation)) +
  geom_text_repel(aes(label = Nation), size = 3) +
  scale_x_continuous(limits = c(0, 30000), breaks = seq(0, 30000, 5000)) +
  labs(title = "HDI vs Electricity Use", subtitle = "",  y = "Human Development Index", x = "Annual per capita Electricity Use, kWh") +
  theme(axis.text.x = element_text(angle=0, hjust = 0), plot.background=element_rect(fill="lightyellow")) +
  theme(axis.text.y=element_text(color= "dodgerblue4"), axis.title.y=element_text(color = "dodgerblue4")) +
  theme(axis.text.x=element_text(color = "dodgerblue4", angle = 0, vjust = 0, hjust = 0), axis.title.x=element_text(color = "dodgerblue4")) +
    theme(legend.position = "none")
