Optimal stopping is a powerful rule in decision-making to maximise the reward. A famous example of strategy is the secretary problem or the fussy suitor problem.
The basic idea is the following. The person wants to choose the best one from a long list of candidates. She can get relevant data (e.g. through an interview process) from each prospect, one at a time. And she must decide to select or reject immediately after the interview. Although the ranking score remains available for reference, she can’t retake the rejected one.
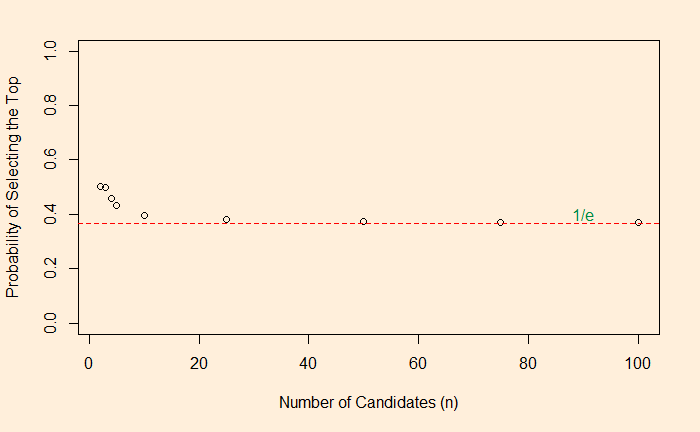
The odds algorithm describes the solution to this problem and says that the probability of finding the optimal solution can be as high as (1/e ~ 37%) by following a methodology. e = 2.718, which is the base of the natural logarithm. The process is simple: if you have n candidates for the selection, give the candidates a score, reject the first n/e of them and then select the one whose score is greater than the greatest of the first n/e!
Let me explain. Imagine there are ten candidates (n = 10). Start the interview and score. Record the highest score of the first three (~ 10/2.718) but reject them all. Then, from the fourth candidate onwards, whoever gets a score more than the previous highest gets selected. The probability for the selected to be the best in the group of ten is about 37%.
We will look at the proof later, but let us run a Monte Carlo that verifies this idea using the following R code. Note this is not an algorithm to find the best, but one way of getting the chance of finding the highest number from a set of randomised numbers.
iter <- 100000

suitor <- replicate(iter, {
  high_number <- 100
  x <- 1:high_number
  x_rand <- sample(x)

  min_num <- round(high_number/2.71)
  mmx <- max(x_rand[1:min_num])

  next_one <- min_num:high_number

  for (i in next_one){
      if(x_rand[i] > mmx){break}

}

   if(x_rand[i] == high_number){
   counter = 1
   }else{
   counter = 0
   }
})

mean(suitor)
Here is the plot representing the probability as a function of the number of candidates.


