We have seen the concepts of joint and conditional probabilities as mathematical expressions. Today, we discuss an approach to understanding the concepts using something familiar to us – using tables.
Tabular power
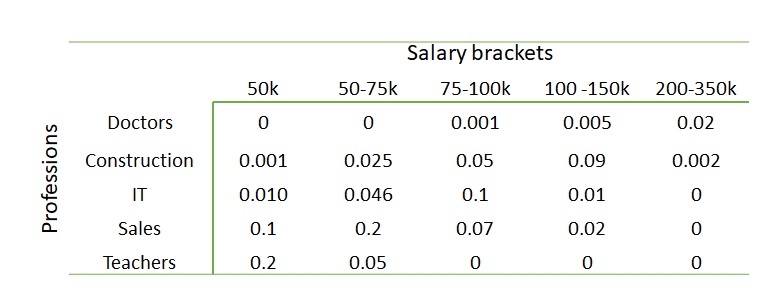
Tables are a common but powerful way of summarising data. Following is one summary from a hypothetical sample collection of salary ranges of five professionals.

It is intuitive for you to know that the values inside the table are the joint occurrences of the row attributes (professions) and column attributes (salary brackets). You get something similar to a probability once you divide these numbers by the total number of samples (= 1000). In other words, the values inside the table give us the joint probabilities.

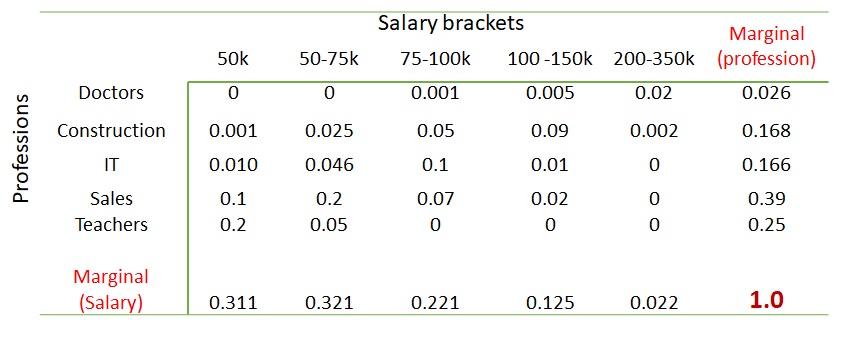
Can you spot the marginal probabilities, say, that of doctors in that sample space? Add the numbers of the rows or columns; you get it.

Conditional probabilities
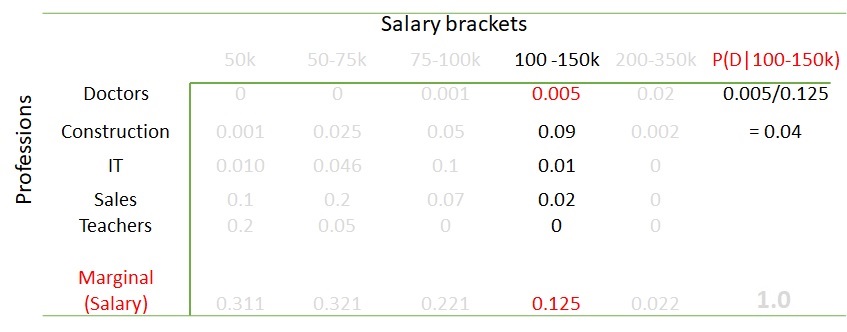
What are the chances it is a doctor if the salary bracket is 100-150k per annum? You only need to look at the column for 100-150k (because that was given) and then calculate the proportion of doctors in it. That is 0.005 out of 0.125 or 0.005/0.125 = 0.04 or 4%.

Look it this way: in the sample space, were 125 people in the given salary bracket, of which five were doctors. If the sample holds it for the population, the percentage becomes 5/125 or 4%.
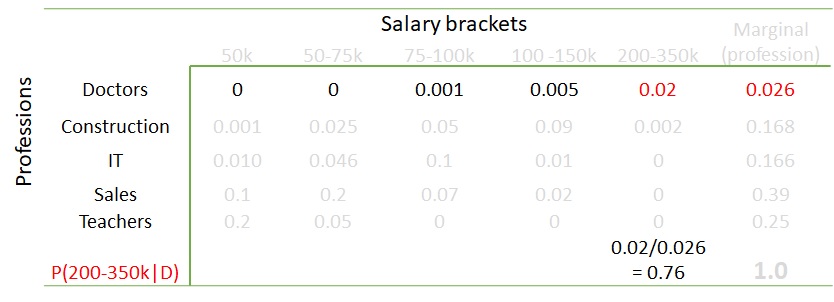
The calculation can also work in the other way. What is the probability of someone in the salary bracket of 200-350k per year, given the person is a doctor? Work out the math, and you get 76%.


