We did establish Poisson distribution through coin tossing. Here we calculate the distance between the arrivals or the interarrival times. This is obtained by marking the indices of heads and then finding the difference between two successive heads.
First, we run 100000 simulations of coin-tossing and collect the heads (H) as successes in an array. Find out the indices of the array, which are nothing but the arrival times. The difference between the indices is the interarrival times.
n <- 100000
xx_f <- sample(c("H", "T"), n, TRUE, prob = c(1/2, 1/2))
index <- which(xx_f =="H")

length(index)
dist <- rep(0,length(index)-1)
for (i in 1:length(index)-1) {
  dist[i] <- index[i+1] - index[i]
}
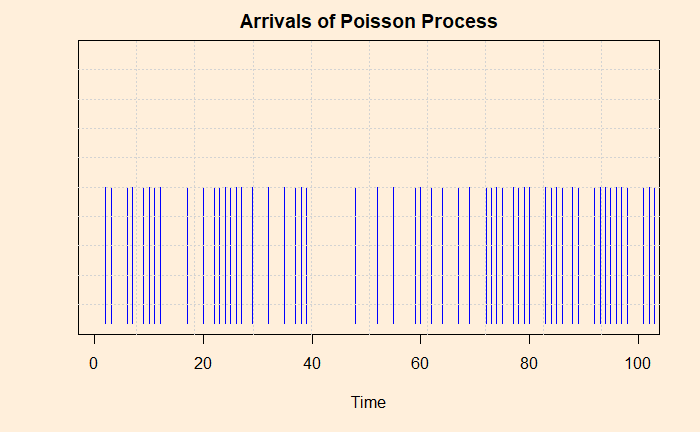
We show the first 100 appearances of H in the following plot.

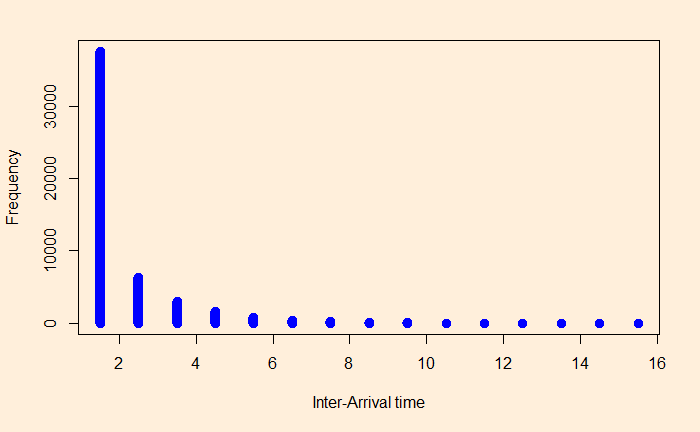
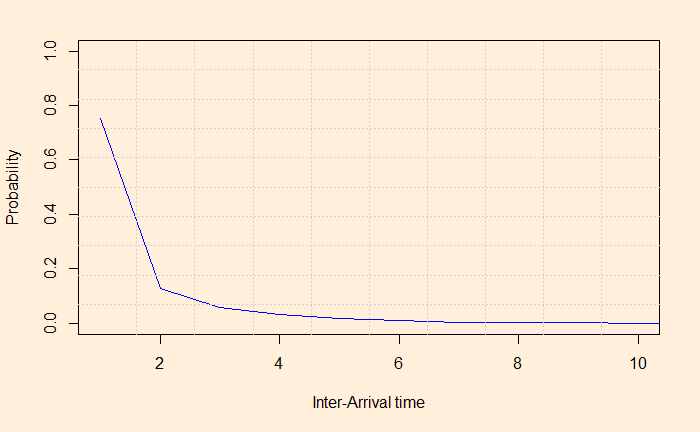
The frequencies and densities of the interval arrival distances are in the graphs.


These describe exponential distributions!

